PROTECTED SOURCE SCRIPT
Actualizado EVA - Daily Candle Box

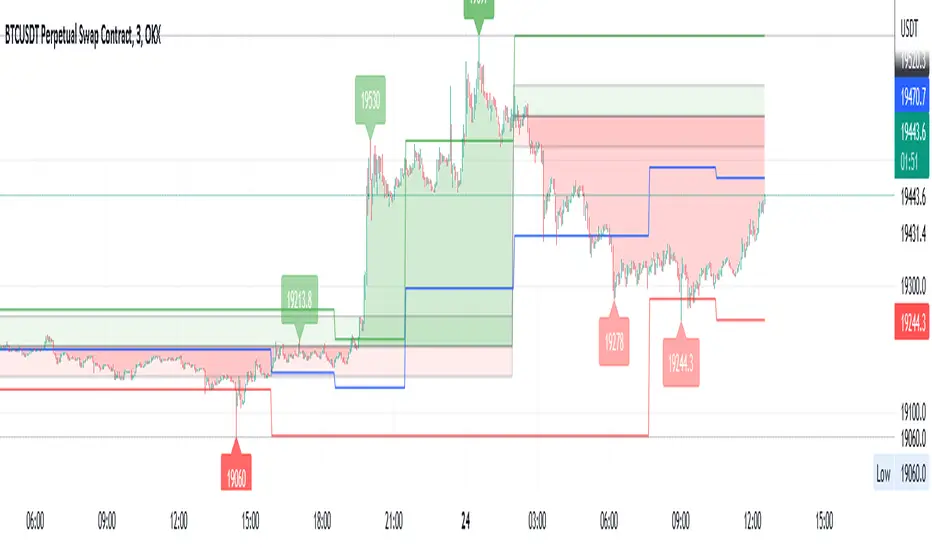
This is a very simple indicator who display few information about the LAST daily candle. ( it is possible to change the timeframe to have information about last week or last hour )
The green background zone is the channel between last daily candle close and last daily high.
The red background zone is the channel between last daily candle close and last daily low.
The middle line display the last daily candle close.
You can desactivate some display , and let just what you need.
If you have any idea to improve it , let me a message !
Notas de prensa
There are few new options in this update.Now you can display a range around the last daily closing, to identify a ranging period inside X% around the closing line.
There are some options about high and low pivot , you can display them , and choose the number of candle left and right around the high/low pivot.
To avoid repainting , you can display line on the chart , it give you the information about when the pivot is detected.
It also display a channel between the last high pivot and the last low pivot , and the blue line is the middle between last high and last low.
You can also put a condition about a minimal percentage of gap between high and low pivot , it will display pivot only when it's X% between high and low.
And to finish it , you can put a condition to keep a minimal percentage of range between the last daily closing to save a pivot , it will display high only above X% about daily closing, and low only below X% of daily closing.
It can give you a range around the last daily closing , between big high and big low.
You can combine all theses options together.
Script protegido
Este script se publica como código cerrado. No obstante, puede utilizarlo libremente y sin ninguna limitación. Obtenga más información aquí.
Exención de responsabilidad
La información y las publicaciones no constituyen, ni deben considerarse como asesoramiento o recomendaciones financieras, de inversión, de trading o de otro tipo proporcionadas o respaldadas por TradingView. Más información en Condiciones de uso.