OPEN-SOURCE SCRIPT
Actualizado Earnings [theUltimator5]
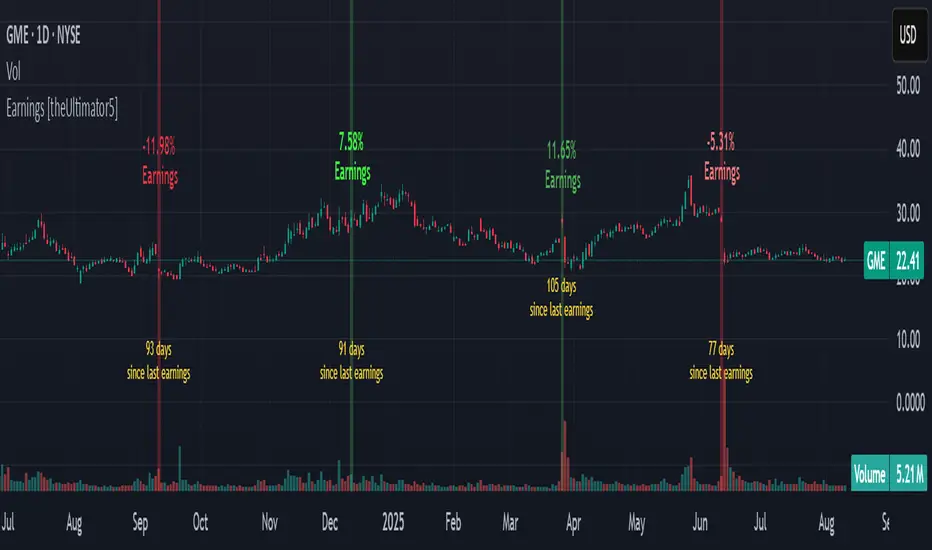
This indicator highlights daily price changes on earnings announcement days using dynamic colors, labels, and optional earnings markers.
🔍 Key Features:
Earnings Detection:
Price Change Calculation:
Color-coded Labels:
Color intensity reflects the size and direction of the move:
Optional "Earnings" Marker:
Background Highlight:
⚙️ User Input:
✅ Show 'E' Marker: Toggles the visibility of the "Earnings" label below the main price change label.
✅ Ideal Use Case:
Use this indicator to visually analyze how a stock reacts on earnings days, helping traders spot consistent behavior patterns (e.g., post-earnings rallies or selloffs).
🔍 Key Features:
Earnings Detection:
- Highlights only the days when an earnings event occurs.
Price Change Calculation:
- Computes the percentage change from open to close on earnings day.
Color-coded Labels:
- Displays the % change as a floating label above the chart on earnings days.
Color intensity reflects the size and direction of the move:
- Bright green for large gains (≥ +10%)
- Bright red for large losses (≤ -10%)
- White for negligible change
- Gradient fades between those extremes
Optional "Earnings" Marker:
- A small label marked “Earnings” appears beneath the % change label, controlled by a user toggle.
Background Highlight:
- The chart background is shaded on earnings days with a semi-transparent color based on the % change.
⚙️ User Input:
✅ Show 'E' Marker: Toggles the visibility of the "Earnings" label below the main price change label.
✅ Ideal Use Case:
Use this indicator to visually analyze how a stock reacts on earnings days, helping traders spot consistent behavior patterns (e.g., post-earnings rallies or selloffs).
Notas de prensa
Added number of days since last earnings at bottom of chart.Removed option for showing "E" for earnings, and change it to simply be below the price change.
Added user select to show days since last earnings.
Notas de prensa
I updated the calculation for earnings day percent change. Precious one was incorrect. I also slightly modified how the labels are positioned since they would easily be out of bounds, especially if viewed on mobile. Instead of using a 200 day high/low to create the labels, I now use a 5 day high/lowNotas de prensa
Updated chart to show indicator name in order to abide by house rules.Script de código abierto
Fiel al espíritu de TradingView, el creador de este script lo ha convertido en código abierto, para que los traders puedan revisar y verificar su funcionalidad. ¡Enhorabuena al autor! Aunque puede utilizarlo de forma gratuita, recuerde que la republicación del código está sujeta a nuestras Normas internas.
Exención de responsabilidad
La información y las publicaciones no constituyen, ni deben considerarse como asesoramiento o recomendaciones financieras, de inversión, de trading o de otro tipo proporcionadas o respaldadas por TradingView. Más información en Condiciones de uso.
Script de código abierto
Fiel al espíritu de TradingView, el creador de este script lo ha convertido en código abierto, para que los traders puedan revisar y verificar su funcionalidad. ¡Enhorabuena al autor! Aunque puede utilizarlo de forma gratuita, recuerde que la republicación del código está sujeta a nuestras Normas internas.
Exención de responsabilidad
La información y las publicaciones no constituyen, ni deben considerarse como asesoramiento o recomendaciones financieras, de inversión, de trading o de otro tipo proporcionadas o respaldadas por TradingView. Más información en Condiciones de uso.