OPEN-SOURCE SCRIPT
FXS
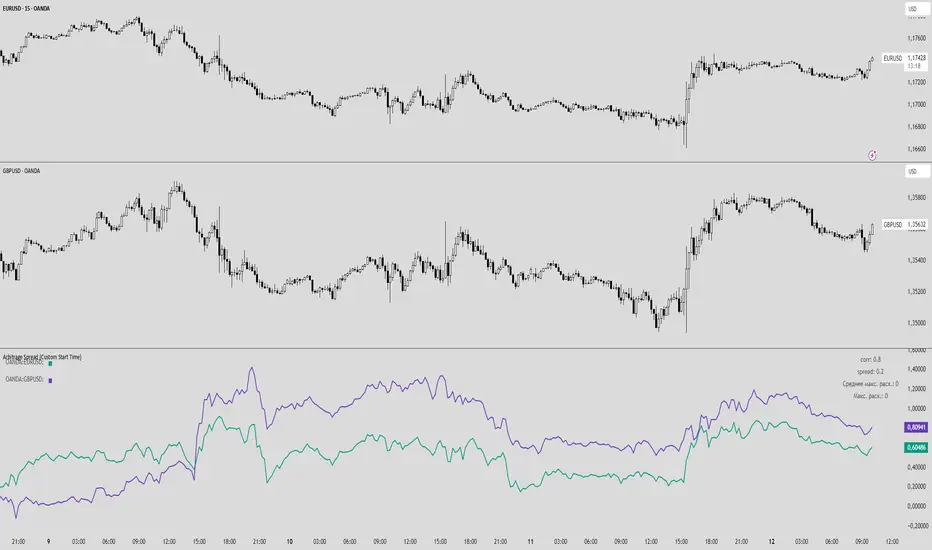
Arbitrage Spread (Custom Start Time)
This indicator analyzes the spread and correlation between two selected instruments or currency pairs.
Key Features:
Displays the percentage change of the two instruments in a separate chart (does not overlay the main chart).
Lines show the entire historical price movement of the selected instruments.
Calculates the current spread and correlation from a chosen date and time (default — last Monday 00:00).
Spread and corr values are rounded to two decimal places for convenience.
The top-right table displays:
corr — correlation coefficient between the instruments,
spread — current spread between the pairs,
Average max deviation for the period — manual input,
Maximum deviation for the entire period — manual input.
The top-left table shows the color of each pair for clarity.
Alerts can be set for specific corr and spread values.
Features:
Historical lines allow visual tracking of dynamics over the entire available period.
Current spread is calculated separately from the selected start time, allowing analysis of current conditions without affecting historical visualization.
Fully customizable: line colors, calculation period, start date/time for spread, manual statistical data.
Script de código abierto
Fiel al espíritu de TradingView, el creador de este script lo ha convertido en código abierto, para que los traders puedan revisar y verificar su funcionalidad. ¡Enhorabuena al autor! Aunque puede utilizarlo de forma gratuita, recuerde que la republicación del código está sujeta a nuestras Normas internas.
Exención de responsabilidad
La información y las publicaciones no constituyen, ni deben considerarse como asesoramiento o recomendaciones financieras, de inversión, de trading o de otro tipo proporcionadas o respaldadas por TradingView. Más información en Condiciones de uso.