Wavelet Kernal ATR [BackQuant]
Introduction
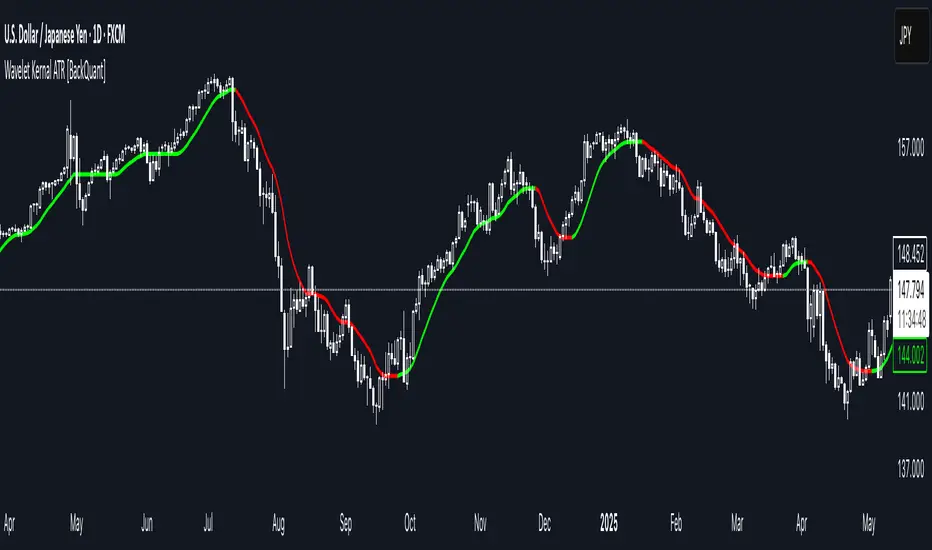
Wavelet Kernal ATR is a closed-source, chart-side tool that fuses an edge-preserving “wavelet kernal” smoother with an ATR-aware regime line. The goal is simple: follow the real move, ignore the static, and give you clean, visual places to manage risk. It can color the trend directly on price, flip states when regime changes, and (optionally) add a secondary moving-average overlay for confirmation all while keeping the chart readable.
What it is
A single adaptive baseline designed to act like a “bias rail.” When it’s up, you favor longs; when it’s down, you favor shorts. It updates in a way that’s responsive to fresh information but resistant to insignificant wiggles. Around that baseline, an ATR-scaled envelope governs how and when the line concedes to volatility, which helps avoid flip-flopping in chop. Because this release is closed source, the following focuses on behavior and practical use rather than internal math.
What it’s used for
- Bias & context: Read the backdrop with one glance; green = bullish regime, red = bearish regime.
- Timing: Use slope changes and pullbacks to the line for entries aligned with the dominant push.
- Risk placement: The line and its volatility envelope give intuitive zones for stops and targets.
- Clarity: Paint candles by state and keep other overlays to a minimum to reduce decision noise.
Why “Wavelet Kernal” matters (plain English)
A wavelet kernal is a localized, scale-aware weighting profile. Instead of averaging every bar equally—or with a single, fixed decay—it emphasizes the most informative part of the recent window while softly down-weighting points that are either too old or too extreme. Three practical benefits result:
- Edge preservation: Turning points are less “smeared” than with conventional smoothers, so the line can pivot sooner on genuine breakouts without chasing every tick.
- Multi-scale sensitivity: The kernal “listens” to structure at multiple scales inside a compact window, helping it track swing-sized movement while suppressing micro-chop.
- Lag vs. noise balance: Because the weighting is localized and shape-aware, you get a calmer line at similar responsiveness compared to common filters; fewer false flips, more meaningful ones.
You don’t need to know the internals to use it: think of the wavelet kernal as a smart stethoscope for price. It hears the heartbeat (trend/impulse) and ignores the coughs (random spikes).
How it behaves
- Trend mode: When price expands directionally, the line “sticks” to the move and stays colored in that direction. Pullbacks that remain shallow relative to volatility usually do not flip the state.
- Transition mode: After a large push, the line may flatten as volatility compresses. Flat + frequent small flips is the platform telling you: edge is low, wait for expansion.
- Shock handling: On sudden spikes, the ATR envelope acts like a reality check—minor overreactions are absorbed, while statistically meaningful breaks force the baseline to concede and re-anchor.
Reading the line (quick heuristics)
- Green + rising: Bias long; look for pullbacks toward the line that stall and resume.
- Red + falling: Bias short; look for rallies into the line that fade.
- Flat + rapid color flips: Stand down or scale down—let the next expansion choose the side.
- Color flip at a prior S/R: Treat as a higher-quality signal than flips in the middle of nowhere.
Baseline + ATR corridor (concept)
The volatility envelope isn’t drawn as two fat bands here; it’s used internally to keep the baseline honest. You can think of it as a “breathing room” rule: the line is allowed to adapt with trend, but it shouldn’t jump the fence unless price movement is large enough relative to recent volatility. That’s why the tool feels calm in chop and decisive during actual breaks.
Optional MA Overlay (confluence)
You can overlay a moving average of the baseline itself for slower-regime confirmation. When both agree (baseline direction and its MA slope), you have trend alignment. When they diverge, expect digestion or a possible transition. Keep this overlay subtle; it’s a context layer, not another signal firehose.
What it plots
- Wavelet ATR line — the adaptive baseline that flips color with regime.
- Optional MA of the baseline — slower confirmation, on or off.
- Candle painting — bars can inherit long/short state for instant read-through.
- Alerts — available for state flips up/down.
Inputs explained (effect on behavior)
Wavelet ATR Calculation
- Price Source — Default hlc3; choose your preferred composite of OHLC.
- Kernal Calculation Length — The horizon the kernal “listens to.” Longer = steadier, fewer flips; shorter = snappier, more flips.
- Kernal Alpha — How strongly the kernal prioritizes the freshest data inside that horizon. Higher alpha = quicker to acknowledge new pushes; lower alpha = more patience.
- ATR Period — Determines the volatility memory. Shorter = envelope reacts faster; longer = envelope demands more evidence to concede.
- ATR Factor — Scales how “strict” the envelope is. Larger factor = more tolerance (fewer flips); smaller = more sensitivity (earlier regime shifts).
Confluence
- Show Atr Moving Average — Turns on the secondary overlay.
- MA Type — Choose the flavor you read best (simple, exponential, linear regression, etc.).
- Moving Average Period — The overlay’s horizon; treat it as a background current.
- Volume Factor / Sigma (when applicable) — Specialized parameter used by certain MA types to shape smoothness.
Plotting & UI
- Plot Wavelet ATR — Toggle the main line.
- Paint Candles According to Trend — Color bars by the baseline’s state.
- Long/Short Colors — Match your chart theme.
A practical playbook
- Trend-pullback continuationSetup: Baseline is green and rising. Price pulls back toward it, stalls (small bodies or wicks into the line), then resumes upward.
Idea: Enter on the resumption. Protective stop often lives just below the line or the last swing low. Scale targets through prior highs or measured projections. - Breakout + acceptanceSetup: Baseline flattens after consolidation. Price expands away; baseline turns green/red and stays that way as two or three bars “accept” the new area.
Idea: Join on the first controlled retest toward the line. If the line instantly loses color again, treat it as a fakeout. - Failed test / flip-and-goSetup: Price challenges the line from the wrong side but cannot close through it convincingly; shortly after, the baseline flips color back in the original direction.
Idea: Use that failed test as a springboard—risk tucked beyond the failed side.
Quality checks before you click
- Structure context: Is the flip happening near prior highs/lows, session opens, or well-observed levels? Flips at structure carry more information.
- Volatility posture: If range is compressing, be picky. If range is expanding, respect the first pullback after the flip.
- Clutter discipline: Use the fewest layers that earn their place. Trend line + candle painting is often enough.
Common questions
- “Why did the line not flip on that spike?” Because the move wasn’t large or sustained enough relative to recent volatility. The envelope forces patience.
- “Why did it flip and then flip back?” That’s what digestion looks like. The kernal preserves edges, but when the market truly has no edge, brief flips are information: sit tight.
- “Do I need the overlay MA?” No. It’s optional context. If it helps you filter marginal trades, keep it. If it adds noise, turn it off.
Troubleshooting & fine-tuning (principles, not prescriptions)
- Too many flips? Increase the Kernal Calculation Length or the ATR Factor. You’re asking for a steadier bias.
- Feels late on strong trends? Nudge Kernal Alpha higher or shorten the Kernal Length. You’re asking for earlier acknowledgment.
- Stops feel random? Place initial risk just beyond the baseline (or the last swing beyond it), then trail only when fresh structure appears.
- Charts feel crowded? Keep the baseline + candle coloring; hide the overlay and other ornaments.
Alerts
- Wavelet ATR Trend Up
- Wavelet ATR Trend Down
Final notes
This tool is built to minimize analysis fatigue: one adaptive line, strong visual feedback, and enough discipline from volatility logic to avoid the “every blip is a signal” trap. The internal math, weighting shapes, and state logic are proprietary and intentionally not disclosed here; you still have full control of behavior through the inputs above. As always, align the settings with your own trade plan, keep the chart readable, and let confluence—not clutter—do the heavy lifting.
Script que requiere invitación
Solo los usuarios autorizados por el autor pueden acceder a este script. Deberá solicitar y obtener permiso para utilizarlo. Por lo general, este se concede tras realizar el pago. Para obtener más información, siga las instrucciones del autor indicadas a continuación o póngase en contacto directamente con BackQuant.
TradingView NO recomienda pagar por un script ni utilizarlo a menos que confíe plenamente en su autor y comprenda cómo funciona. También puede encontrar alternativas gratuitas y de código abierto en nuestros scripts de la comunidad.
Instrucciones del autor
Or go to backquant.com/
Exención de responsabilidad
Script que requiere invitación
Solo los usuarios autorizados por el autor pueden acceder a este script. Deberá solicitar y obtener permiso para utilizarlo. Por lo general, este se concede tras realizar el pago. Para obtener más información, siga las instrucciones del autor indicadas a continuación o póngase en contacto directamente con BackQuant.
TradingView NO recomienda pagar por un script ni utilizarlo a menos que confíe plenamente en su autor y comprenda cómo funciona. También puede encontrar alternativas gratuitas y de código abierto en nuestros scripts de la comunidad.
Instrucciones del autor
Or go to backquant.com/