OPEN-SOURCE SCRIPT
Actualizado Dynamic 21 SMA Zone S/R (Weekly and 2-Day)

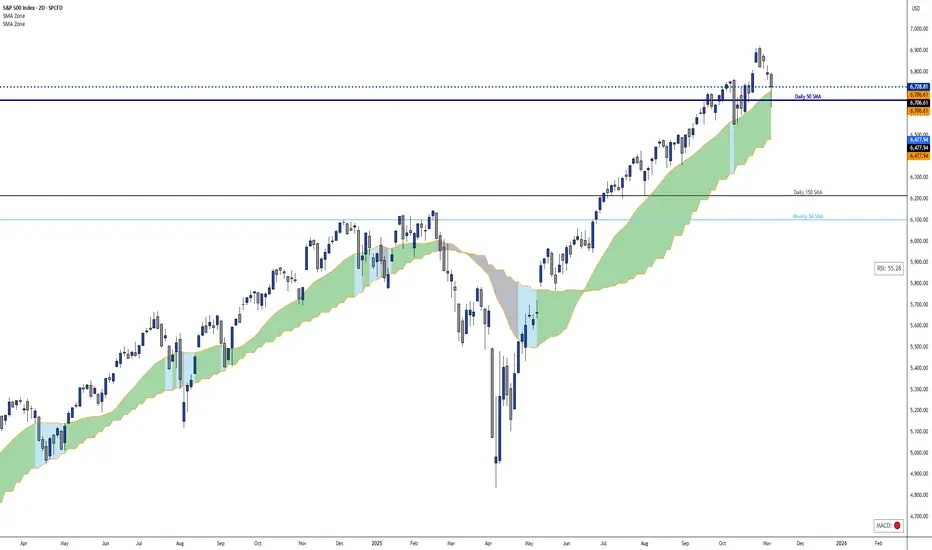
This custom indicator creates a dynamic support and resistance zone based on the 21-period Simple Moving Average (SMA) from the weekly timeframe and the 21-period SMA from the 2-day timeframe. The zone is visible and functional across all chart timeframes, adapting seamlessly to provide multi-timeframe insights.
Color Logic:
Green: When the current price is fully above the upper boundary of the zone, indicating potential bullish strength or a support level.
Gray: When the price is fully below the lower boundary, signaling potential bearish pressure or a resistance level.
Light Blue: When the price is within the zone (between the two SMAs), representing a neutral "no man's land" where the market is indecisive.
As the two SMAs converge or diverge, the zone naturally thins or widens, visually reflecting changes in market momentum—such as a thinning green zone during a potential reversal. Ideal for higher-timeframe swing trading to identify key levels, this indicator is also useful on lower timeframes for gauging the relative position of these SMAs, helping traders align short-term moves with broader trends.
Notas de prensa
This custom indicator creates a dynamic support and resistance zone based on the 21-period Simple Moving Average (SMA) from the weekly timeframe and the 21-period SMA from the 2-day timeframe. The zone is visible and functional across all chart timeframes, adapting seamlessly to provide multi-timeframe insights.Color Logic:
Green: When the current price is fully above the upper boundary of the zone, indicating potential bullish strength or a support level.
Gray: When the price is fully below the lower boundary, signaling potential bearish pressure or a resistance level.
Light Blue: When the price is within the zone (between the two SMAs), representing a neutral "no man's land" where the market is indecisive.
As the two SMAs converge or diverge, the zone naturally thins or widens, visually reflecting changes in market momentum—such as a thinning green zone during a potential reversal. Ideal for higher-timeframe swing trading to identify key levels, this indicator is also useful on lower timeframes for gauging the relative position of these SMAs, helping traders align short-term moves with broader trends.
Notas de prensa
Added a daily and weekly 50 SMA as two horizontal lines, visible on all time frames.Notas de prensa
Added a Daily 150 SMA line.The current RSI value box is positioned in the middle right.
The MACD bullish or bearish crossover signal box is located in the bottom right.
All of these features can be turned on or off in the indicator settings.
Script de código abierto
Fiel al espíritu de TradingView, el creador de este script lo ha convertido en código abierto, para que los traders puedan revisar y verificar su funcionalidad. ¡Enhorabuena al autor! Aunque puede utilizarlo de forma gratuita, recuerde que la republicación del código está sujeta a nuestras Normas internas.
Exención de responsabilidad
La información y las publicaciones no constituyen, ni deben considerarse como asesoramiento o recomendaciones financieras, de inversión, de trading o de otro tipo proporcionadas o respaldadas por TradingView. Más información en Condiciones de uso.