OPEN-SOURCE SCRIPT
Actualizado 29&71 Goldbach levels
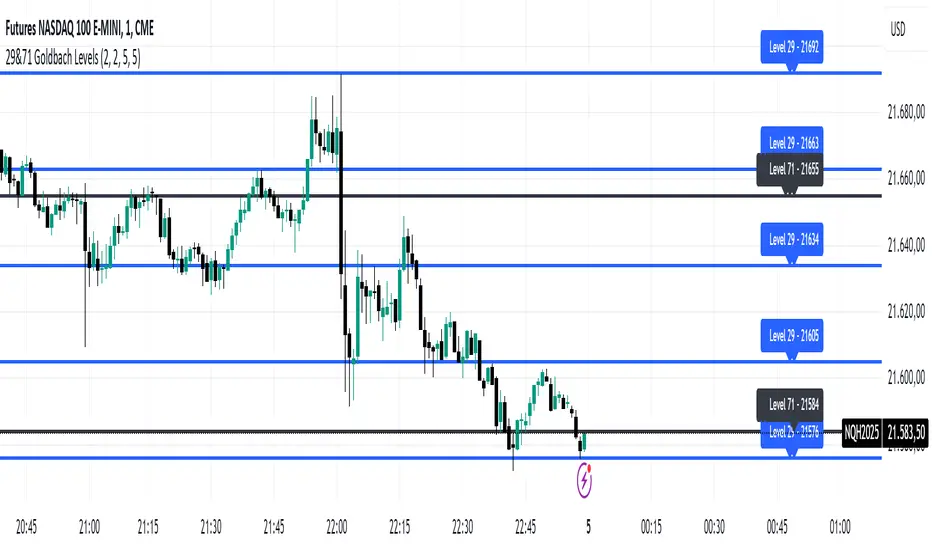
The indicator automatically plots horizontal lines at the 29 and 71 price levels on your chart. These levels serve as psychological barriers in the market, where price action may react or consolidate, just as prime numbers are fundamental in the theory of numbers.
---
Features:
- 29 Level: Identifies significant areas where market participants may encounter support or resistance, similar to the importance of prime numbers in Goldbach's conjecture.
- 71 Level: Marks another key zone that might indicate possible price breakouts or reversals, offering traders a reference point for decision-making.
- Customizable: You can adjust the colors, line styles, or alerts associated with these levels to fit your trading preferences.
How to Use:
- Use the 29 and 71 levels to spot potential areas of support or resistance on the chart.
- Watch for price reactions at these levels for possible breakout or reversal setups.
- Combine the levels with other technical indicators for added confirmation.
---
This indicator blends the theory of prime numbers with market analysis, offering traders a novel approach to identifying key levels that might influence price movements.
---
Features:
- 29 Level: Identifies significant areas where market participants may encounter support or resistance, similar to the importance of prime numbers in Goldbach's conjecture.
- 71 Level: Marks another key zone that might indicate possible price breakouts or reversals, offering traders a reference point for decision-making.
- Customizable: You can adjust the colors, line styles, or alerts associated with these levels to fit your trading preferences.
How to Use:
- Use the 29 and 71 levels to spot potential areas of support or resistance on the chart.
- Watch for price reactions at these levels for possible breakout or reversal setups.
- Combine the levels with other technical indicators for added confirmation.
---
This indicator blends the theory of prime numbers with market analysis, offering traders a novel approach to identifying key levels that might influence price movements.
Notas de prensa
The indicator automatically plots horizontal lines at the 29 and 71 price levels on your chart. These levels serve as psychological barriers in the market, where price action may react or consolidate, just as prime numbers are fundamental in the theory of numbers.---
Features:
- 29 Level: Identifies significant areas where market participants may encounter support or resistance, similar to the importance of prime numbers in Goldbach's conjecture.
- 71 Level: Marks another key zone that might indicate possible price breakouts or reversals, offering traders a reference point for decision-making.
- Customizable: You can adjust the colors, line styles, or alerts associated with these levels to fit your trading preferences.
How to Use:
- Use the 29 and 71 levels to spot potential areas of support or resistance on the chart.
- Watch for price reactions at these levels for possible breakout or reversal setups.
- Combine the levels with other technical indicators for added confirmation.
---
This indicator blends the theory of prime numbers with market analysis, offering traders a novel approach to identifying key levels that might influence price movements.
Notas de prensa
New version plotting by default 71 lev midpointsNotas de prensa
New version with Midpoints for 29 and 71 levelsNotas de prensa
New version - small bugs solvedScript de código abierto
Fiel al espíritu de TradingView, el creador de este script lo ha convertido en código abierto, para que los traders puedan revisar y verificar su funcionalidad. ¡Enhorabuena al autor! Aunque puede utilizarlo de forma gratuita, recuerde que la republicación del código está sujeta a nuestras Normas internas.
Exención de responsabilidad
La información y las publicaciones no constituyen, ni deben considerarse como asesoramiento o recomendaciones financieras, de inversión, de trading o de otro tipo proporcionadas o respaldadas por TradingView. Más información en Condiciones de uso.
Script de código abierto
Fiel al espíritu de TradingView, el creador de este script lo ha convertido en código abierto, para que los traders puedan revisar y verificar su funcionalidad. ¡Enhorabuena al autor! Aunque puede utilizarlo de forma gratuita, recuerde que la republicación del código está sujeta a nuestras Normas internas.
Exención de responsabilidad
La información y las publicaciones no constituyen, ni deben considerarse como asesoramiento o recomendaciones financieras, de inversión, de trading o de otro tipo proporcionadas o respaldadas por TradingView. Más información en Condiciones de uso.