OPEN-SOURCE SCRIPT
Linear Regression with StdDev Bands
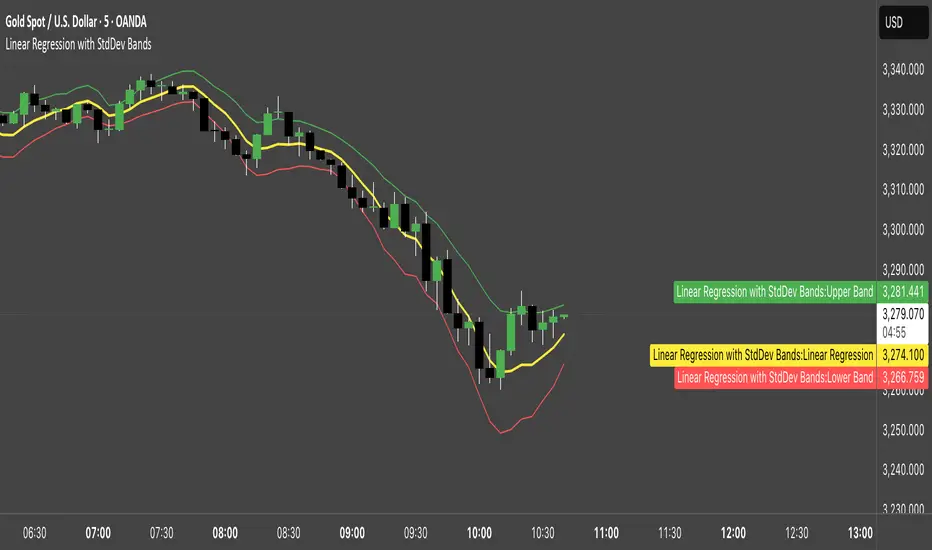
Linear Regression with Standard Deviation Bands Indicator
This indicator plots a linear regression line along with upper and lower bands based on standard deviation. It helps identify potential overbought and oversold conditions, as well as trend direction and strength.
Key Components:
Linear Regression Line: Represents the average price over a specified period.
Upper and Lower Bands: Calculated by adding and subtracting the standard deviation (multiplied by a user-defined factor) from the linear regression line. These bands act as dynamic support and resistance levels.
How to Use:
Trend Identification: The direction of the linear regression line indicates the prevailing trend.
Overbought/Oversold Signals: Prices approaching or crossing the upper band may suggest overbought conditions, while prices near the lower band may indicate oversold conditions.
Dynamic Support/Resistance: The bands can act as potential support and resistance levels.
Alerts: Option to enable alerts when the price crosses above the upper band or below the lower band.
Customization:
Regression Length: Adjust the period over which the linear regression is calculated.
StdDev Multiplier: Modify the width of the bands by changing the standard deviation multiplier.
Price Source: Choose which price data to use for calculations (e.g., close, open, high, low).
Alerts: Enable or disable alerts for band crossings.
This indicator is a versatile tool for understanding price trends and potential reversal points.
Script de código abierto
Fiel al espíritu de TradingView, el creador de este script lo ha convertido en código abierto, para que los traders puedan revisar y verificar su funcionalidad. ¡Enhorabuena al autor! Aunque puede utilizarlo de forma gratuita, recuerde que la republicación del código está sujeta a nuestras Normas internas.
Exención de responsabilidad
La información y las publicaciones no constituyen, ni deben considerarse como asesoramiento o recomendaciones financieras, de inversión, de trading o de otro tipo proporcionadas o respaldadas por TradingView. Más información en Condiciones de uso.