OPEN-SOURCE SCRIPT
Price vs VWAP Performance
Price vs VWAP Performance (PvVWAP)
This indicator visually displays the deviation between the current price and VWAP (Volume Weighted Average Price), helping you to determine the strength of a trend.
How it Works
VWAP Calculation: Calculates the Volume Weighted Average Price (VWAP) over a specified period.
Standard Deviation Calculation: Calculates the standard deviation of closing prices over the past 20 periods.
Deviation Calculation: Calculates the difference between the current price and VWAP, expressed as a multiple of the standard deviation.
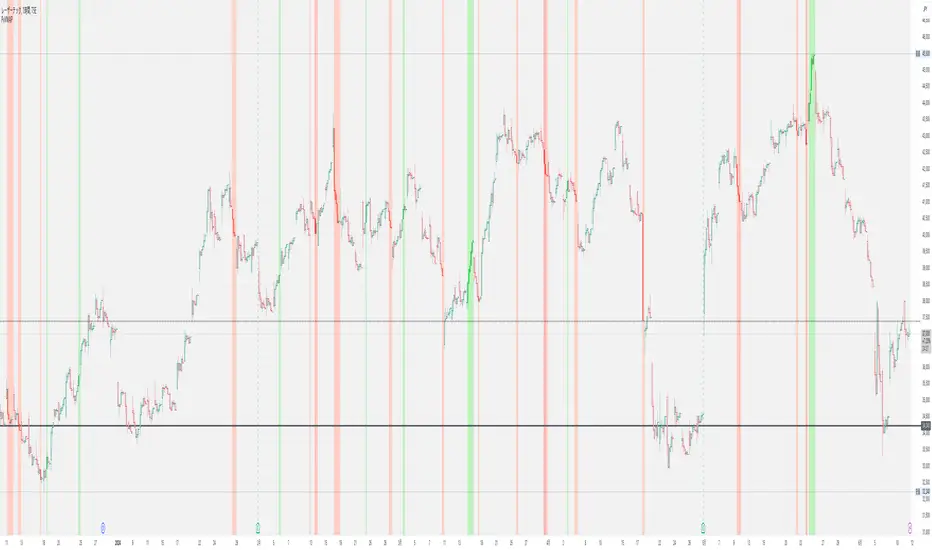
Color Assignment: Changes the color of bars and background based on the magnitude of the deviation.
Green: Very strong uptrend
Light Green: Strong uptrend
Light Gray: No trend
Pinkish Red: Weak downtrend
Red: Very strong downtrend
How to Use
Trend Strength Assessment:
The greater the deviation of the price from VWAP, the stronger the trend is considered to be.
The color of the bars and background provides a visual indication of trend strength.
Entry/Exit Point Reference:
You can enter/exit by aiming for the movement of the price returning to VWAP after a large deviation from VWAP.
Notes
Parameter Settings:
The standard deviation period is 20 periods by default, but can be adjusted as needed.
Avoid Using Alone:
It is recommended to use this indicator in combination with other technical indicators.
This indicator visually displays the deviation between the current price and VWAP (Volume Weighted Average Price), helping you to determine the strength of a trend.
How it Works
VWAP Calculation: Calculates the Volume Weighted Average Price (VWAP) over a specified period.
Standard Deviation Calculation: Calculates the standard deviation of closing prices over the past 20 periods.
Deviation Calculation: Calculates the difference between the current price and VWAP, expressed as a multiple of the standard deviation.
Color Assignment: Changes the color of bars and background based on the magnitude of the deviation.
Green: Very strong uptrend
Light Green: Strong uptrend
Light Gray: No trend
Pinkish Red: Weak downtrend
Red: Very strong downtrend
How to Use
Trend Strength Assessment:
The greater the deviation of the price from VWAP, the stronger the trend is considered to be.
The color of the bars and background provides a visual indication of trend strength.
Entry/Exit Point Reference:
You can enter/exit by aiming for the movement of the price returning to VWAP after a large deviation from VWAP.
Notes
Parameter Settings:
The standard deviation period is 20 periods by default, but can be adjusted as needed.
Avoid Using Alone:
It is recommended to use this indicator in combination with other technical indicators.
Script de código abierto
Fiel al espíritu de TradingView, el creador de este script lo ha convertido en código abierto, para que los traders puedan revisar y verificar su funcionalidad. ¡Enhorabuena al autor! Aunque puede utilizarlo de forma gratuita, recuerde que la republicación del código está sujeta a nuestras Normas internas.
Exención de responsabilidad
La información y las publicaciones no constituyen, ni deben considerarse como asesoramiento o recomendaciones financieras, de inversión, de trading o de otro tipo proporcionadas o respaldadas por TradingView. Más información en Condiciones de uso.