OPEN-SOURCE SCRIPT
10% Drop from Current High - Akshay

10% Drop from Current High TradingView Indicator
Description:
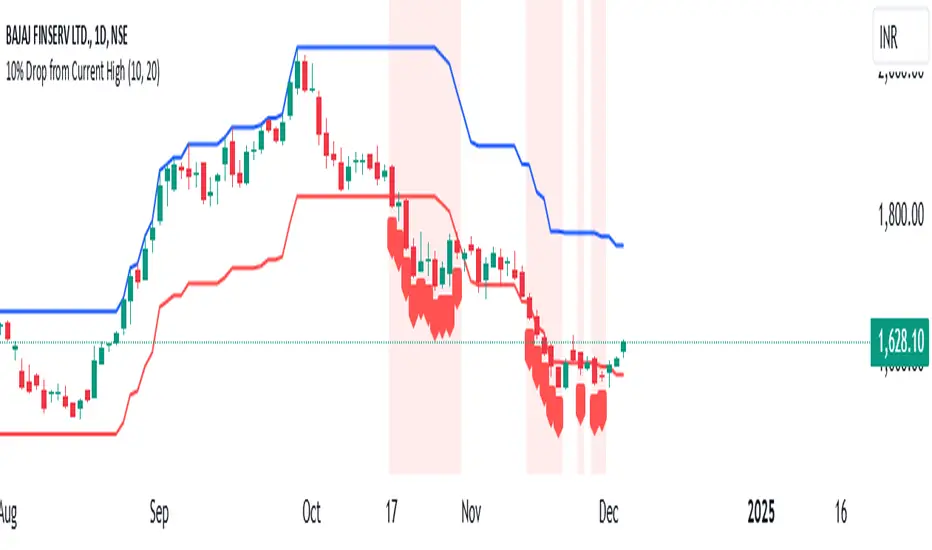
The "10% Drop from Current High" indicator dynamically tracks the highest price within a user-defined period and highlights when the current price drops by a specified percentage. This tool is invaluable for traders looking to monitor significant pullbacks or corrections from recent highs.
Key Features:
Customizable Drop Percentage:
Allows users to set the percentage drop to track, with a default value of 10%.
Configurable via an input field to suit different trading strategies and market conditions.
Lookback Period:
Tracks the highest price over a user-defined lookback period (default is 20 bars).
This ensures the indicator adapts to short-term or long-term market conditions based on user preferences.
Dynamic Levels:
Current High Level: Plots the highest price within the lookback period in blue.
Drop Level: Plots the calculated drop level (e.g., 10% below the current high) in red.
Visual Alerts:
Background Highlighting:
A translucent red background appears when the current price is at or below the drop level, signaling a significant pullback.
Shape Marker:
A downward label is plotted below the bar when the price touches or falls below the drop level, providing cSet Alerts:lear visual feedback.
Overlay on Price Chart:
The indicator is plotted directly on the price chart (overlay=true), ensuring seamless integration with other technical analysis tools.
Use Case:
This indicator is designed for traders who want to:
Monitor Pullbacks:
Identify when the price of an asset experiences a defined percentage drop from its recent high, signaling potential reversal zones or buying opportunities.
Use visual cues to react quickly to price movements.
Analyze Trends:
Combine with other indicators to assess the strength of trends and corrections.
Customization Options:
Drop Percentage: Adjust the percentage drop to track based on asset volatility and trading strategy.
Lookback Period: Modify the lookback period to focus on short-term (e.g., 5 bars) or long-term (e.g., 50 bars) price highs.
This indicator provides a flexible and intuitive way to track price pullbacks, helping traders make informed decisions and stay ahead in dynamic market conditions.
Script de código abierto
Fiel al espíritu de TradingView, el creador de este script lo ha convertido en código abierto, para que los traders puedan revisar y verificar su funcionalidad. ¡Enhorabuena al autor! Aunque puede utilizarlo de forma gratuita, recuerde que la republicación del código está sujeta a nuestras Normas internas.
Exención de responsabilidad
La información y las publicaciones no constituyen, ni deben considerarse como asesoramiento o recomendaciones financieras, de inversión, de trading o de otro tipo proporcionadas o respaldadas por TradingView. Más información en Condiciones de uso.