OPEN-SOURCE SCRIPT
Asian, UK & NY SessionTimes and Day Highs and Lows
What It Does
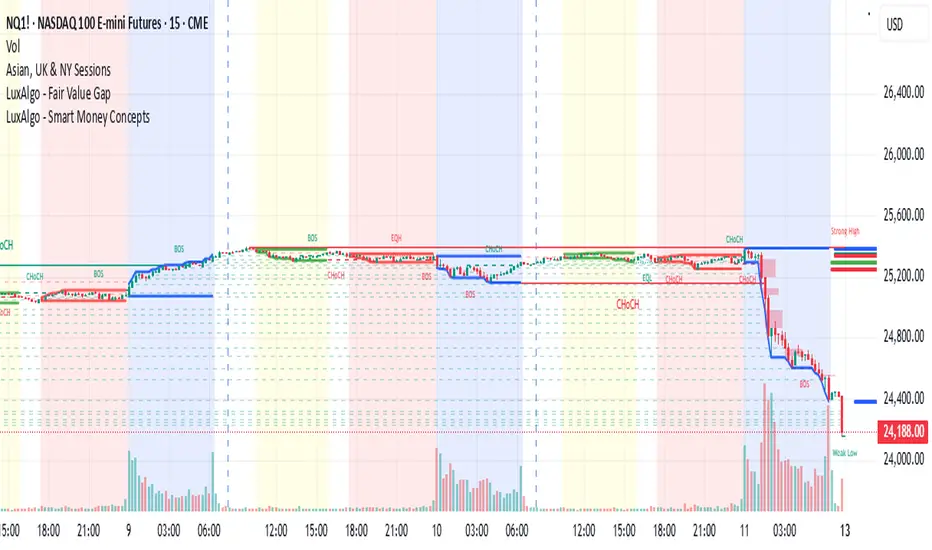
The Asian, UK & NY Sessions indicator automatically identifies and highlights the three major global trading sessions on your chart.
For each session, it:
Detects session time in its local timezone.
Tracks the session’s highest and lowest prices.
Plots colored horizontal lines to show those levels throughout the trading day.
Optionally shades each session’s background in its signature color for instant visual context:
🟡 Asian Session: Yellow background
🔴 London Session: Red background
🔵 New York Session: Blue background
This helps traders see how price reacts within and between sessions — spotting overlaps, liquidity zones, and daily ranges.
⚙️ Inputs and Variables
Input Description
Extend lines until next session start (extendLines) Extends each session’s high/low lines forward until the next session begins.
Show prices in scale column (showScaleValues) Controls whether the price labels for session highs/lows appear on the chart’s right-hand price scale.
Show All Session Highs & Lows (showAllHighsLows) Master switch — turn this off to hide all session lines instantly, keeping the chart clean.
Show Session Backgrounds (showBackgrounds) Turns all background shading on or off. When off, all session colors disappear.
Background Opacity (bgOpacityAll) Adjusts the transparency for all session backgrounds (0 = solid, 100 = fully transparent).
🎨 Visual Color Scheme
Session Background High/Low Line
Asian Yellow Green
London Red Red
New York Blue Blue
Each color has a consistent role — making it easy to distinguish sessions even in replay or live view.
Price Tracking:
For each session, the indicator resets High and Low when the new session starts, then updates them as bars print.
Display Control:
If lines or backgrounds are disabled via settings, they’re completely hidden (no clutter, no partial transparency).
💡 How Traders Use It
Identify daily ranges in each global session.
Compare volatility between markets.
Align entries or exits with session transitions.
Observe how price respects previous session highs/lows.
Script de código abierto
Fiel al espíritu de TradingView, el creador de este script lo ha convertido en código abierto, para que los traders puedan revisar y verificar su funcionalidad. ¡Enhorabuena al autor! Aunque puede utilizarlo de forma gratuita, recuerde que la republicación del código está sujeta a nuestras Normas internas.
Exención de responsabilidad
La información y las publicaciones no constituyen, ni deben considerarse como asesoramiento o recomendaciones financieras, de inversión, de trading o de otro tipo proporcionadas o respaldadas por TradingView. Más información en Condiciones de uso.