OPEN-SOURCE SCRIPT
Actualizado Composite RSI
One issue with the famouse RSI indicator is that it is too sensitive in some cases and thus, might give false signals if we are eager to use those signals.
If we increase the length of the RSI, it might give too few signals which is not ideal as well.
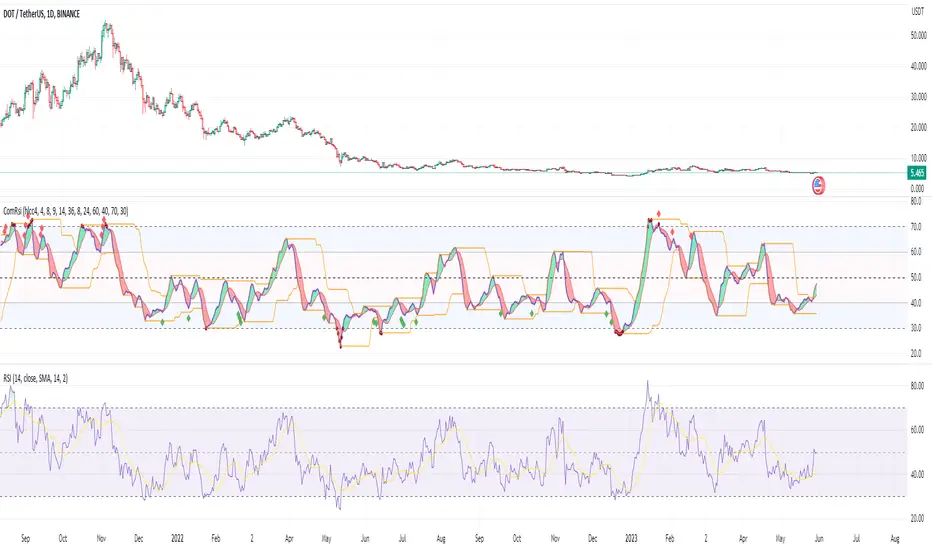
This Composite RSI indicator was created to utilize the RSI strength, using 3 RSIs (with different length) in combination to give less signal than the original one.
You can use it like a normal RSI indicator:
- Try to find the entry when the RSI is in the overbought (RSI >= 70) and oversold (RSI <= 30) areas
- Use bullish divergence and bearish divergence on the RSI itself to signal your trade
In the example chart, I included a built-in RSI as well so you that you can compare the original one and the Composite RSI indicator.
Some extra features:
- Simple bullish and bearish divergences detection.
- Mark the RSI with green circle(s) when it is extremely overbought (over 80) and oversold (under 20)
If we increase the length of the RSI, it might give too few signals which is not ideal as well.
This Composite RSI indicator was created to utilize the RSI strength, using 3 RSIs (with different length) in combination to give less signal than the original one.
You can use it like a normal RSI indicator:
- Try to find the entry when the RSI is in the overbought (RSI >= 70) and oversold (RSI <= 30) areas
- Use bullish divergence and bearish divergence on the RSI itself to signal your trade
In the example chart, I included a built-in RSI as well so you that you can compare the original one and the Composite RSI indicator.
Some extra features:
- Simple bullish and bearish divergences detection.
- Mark the RSI with green circle(s) when it is extremely overbought (over 80) and oversold (under 20)
Notas de prensa
Update chart.Script de código abierto
Fiel al espíritu de TradingView, el creador de este script lo ha convertido en código abierto, para que los traders puedan revisar y verificar su funcionalidad. ¡Enhorabuena al autor! Aunque puede utilizarlo de forma gratuita, recuerde que la republicación del código está sujeta a nuestras Normas internas.
Exención de responsabilidad
La información y las publicaciones no constituyen, ni deben considerarse como asesoramiento o recomendaciones financieras, de inversión, de trading o de otro tipo proporcionadas o respaldadas por TradingView. Más información en Condiciones de uso.
Script de código abierto
Fiel al espíritu de TradingView, el creador de este script lo ha convertido en código abierto, para que los traders puedan revisar y verificar su funcionalidad. ¡Enhorabuena al autor! Aunque puede utilizarlo de forma gratuita, recuerde que la republicación del código está sujeta a nuestras Normas internas.
Exención de responsabilidad
La información y las publicaciones no constituyen, ni deben considerarse como asesoramiento o recomendaciones financieras, de inversión, de trading o de otro tipo proporcionadas o respaldadas por TradingView. Más información en Condiciones de uso.