OPEN-SOURCE SCRIPT
Actualizado EMA 200 Price Deviation Alerts (1H Only)
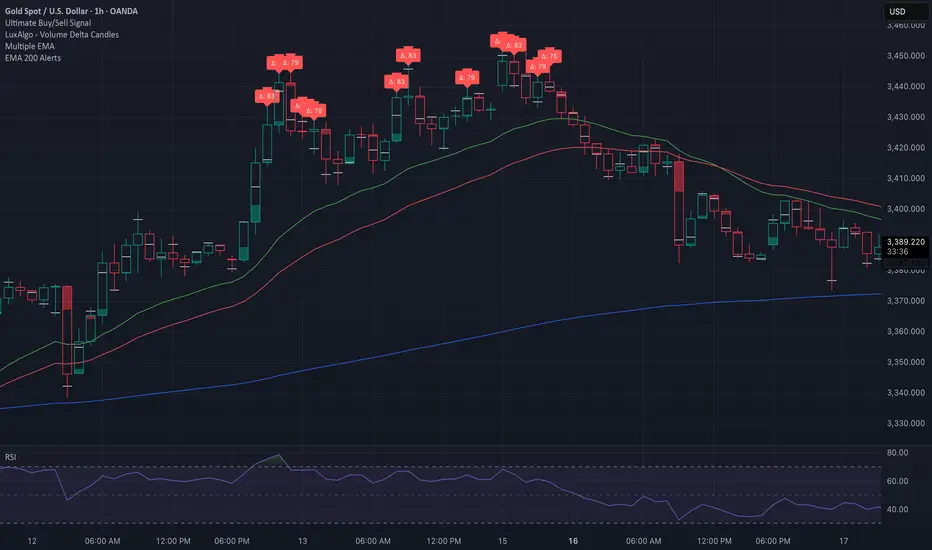
This script monitors the price deviation from the 200-period Exponential Moving Average (EMA) exclusively on the 1-hour chart. It generates alerts when the absolute difference between the current price and the EMA 200 exceeds a user-defined threshold (default: 65).
Features:
Works only on 1-hour (60-minute) charts to avoid false signals on other timeframes.
Customizable deviation threshold via script input.
Visual display of the 200 EMA on the chart.
Alert system to notify when price deviates significantly above or below the EMA.
Buy/Sell arrows shown when conditions are met:
Sell arrow appears when price is above the EMA and deviation exceeds threshold.
Buy arrow appears when price is below the EMA and deviation exceeds threshold.
Use this tool to identify potential overextended price moves relative to long-term trend support or resistance on the 1H timeframe.
Notas de prensa
updated shows difference on 1 HR chart
Notas de prensa
updated bars to show deviation on 1 hr chartNotas de prensa
updated option to select deselect buy/sell signal labelScript de código abierto
Siguiendo fielmente el espíritu de TradingView, el creador de este script lo ha publicado en código abierto, permitiendo que otros traders puedan revisar y verificar su funcionalidad. ¡Enhorabuena al autor! Puede utilizarlo de forma gratuita, pero tenga en cuenta que la publicación de este código está sujeta a nuestras Normas internas.
Exención de responsabilidad
La información y las publicaciones que ofrecemos, no implican ni constituyen un asesoramiento financiero, ni de inversión, trading o cualquier otro tipo de consejo o recomendación emitida o respaldada por TradingView. Puede obtener información adicional en las Condiciones de uso.
Script de código abierto
Siguiendo fielmente el espíritu de TradingView, el creador de este script lo ha publicado en código abierto, permitiendo que otros traders puedan revisar y verificar su funcionalidad. ¡Enhorabuena al autor! Puede utilizarlo de forma gratuita, pero tenga en cuenta que la publicación de este código está sujeta a nuestras Normas internas.
Exención de responsabilidad
La información y las publicaciones que ofrecemos, no implican ni constituyen un asesoramiento financiero, ni de inversión, trading o cualquier otro tipo de consejo o recomendación emitida o respaldada por TradingView. Puede obtener información adicional en las Condiciones de uso.