OPEN-SOURCE SCRIPT
X EMA EQ
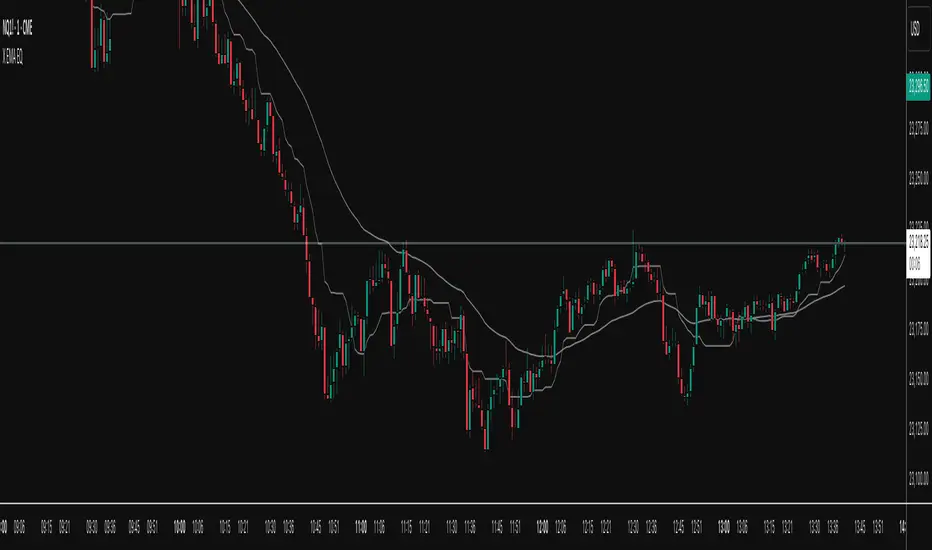
The X EMA EQ is a versatile technical analysis tool designed to overlay price action with customizable Exponential Moving Averages (EMAs) and real-time equilibrium levels. Ideal for intraday traders, it blends trend-following and mean-reversion concepts to highlight both directional bias and potential value zones.
🔹 Key Features:
1. Dual EMA Visualization
Plot up to two user-defined EMAs (default: 20 and 50 periods).
Independently toggle and style each EMA to suit your strategy.
Helps track short- and mid-term trend dynamics with clarity.
2. Running Equilibrium Bands
Displays a real-time dynamic price range based on the highest high and lowest low over a user-defined rolling window (default: 15 minutes).
Includes upper/lower quartile lines and a central midpoint, giving structure to intraday price movement.
Useful for identifying compression, breakouts, and fair value zones.
3. Linear Regression Overlay (Optional)
Apply a smoothed linear regression curve across the same time window.
Highlights directional momentum and price mean trajectory.
Valuable for assessing slope bias and trend strength over the equilibrium period.
4. Intraday Timeframe Optimization
Designed specifically for intraday charts with minute-based resolutions (30 seconds to 60 minutes).
Auto-adjusts logic based on the current chart’s timeframe.
5. Clean Visual Design
Minimalist and translucent color schemes ensure readability without clutter.
All components are independently toggleable for full customization.
⚙️ Settings Overview:
EMA Settings: Enable/disable each EMA, set lengths and colors.
Time & Price Settings: Define the running equilibrium period (in minutes), control visibility of bands and regression line, and adjust styling.
X EMA EQ offers a compact yet powerful visual framework for traders seeking to align with short-term trend structure while keeping an eye on evolving price balance zones.
Script de código abierto
Fiel al espíritu de TradingView, el creador de este script lo ha convertido en código abierto, para que los traders puedan revisar y verificar su funcionalidad. ¡Enhorabuena al autor! Aunque puede utilizarlo de forma gratuita, recuerde que la republicación del código está sujeta a nuestras Normas internas.
Exención de responsabilidad
La información y las publicaciones no constituyen, ni deben considerarse como asesoramiento o recomendaciones financieras, de inversión, de trading o de otro tipo proporcionadas o respaldadas por TradingView. Más información en Condiciones de uso.