OPEN-SOURCE SCRIPT
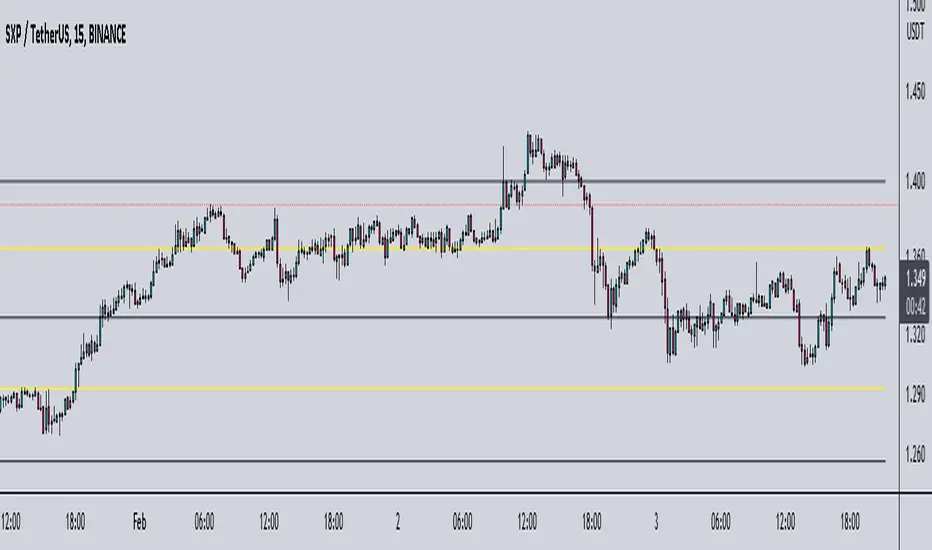
Chart Map[netguard] V1.0

Chart map is a indicator that shows best levels of price.
on this indicator we divided ATH and ATL of chart to 16/32 levels that each one of them can control price and candles.
furthermore you can use weekly or daily map in this indicator.in weekly map we divide High to Low of last week candle to 8 levels that these levels can control candles too.
In general, these levels act as strong support and resistance.
you can trade on these levels with candle patterns.
Script de código abierto
Fiel al espíritu de TradingView, el creador de este script lo ha convertido en código abierto, para que los traders puedan revisar y verificar su funcionalidad. ¡Enhorabuena al autor! Aunque puede utilizarlo de forma gratuita, recuerde que la republicación del código está sujeta a nuestras Normas internas.
Exención de responsabilidad
La información y las publicaciones no constituyen, ni deben considerarse como asesoramiento o recomendaciones financieras, de inversión, de trading o de otro tipo proporcionadas o respaldadas por TradingView. Más información en Condiciones de uso.