OPEN-SOURCE SCRIPT
Actualizado Dynamic Resistance and Support Lines
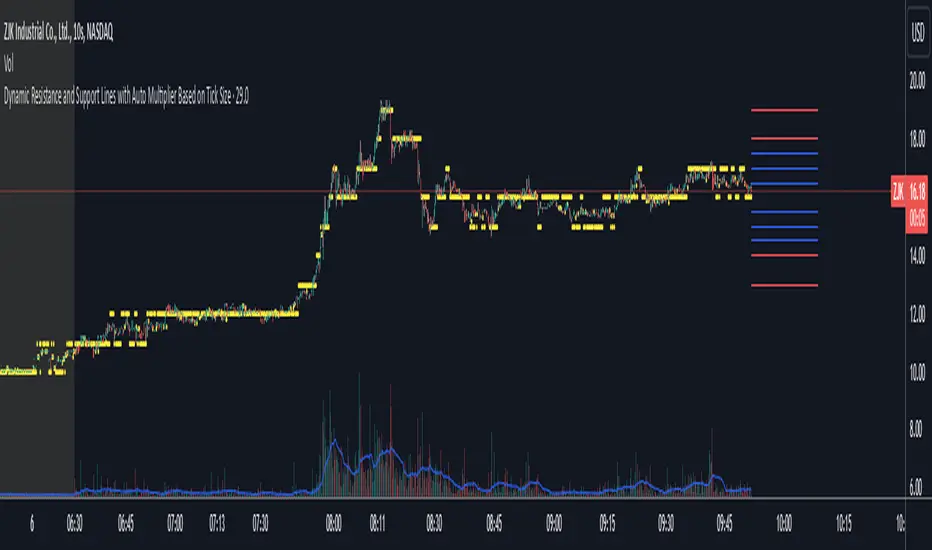
This script is designed to dynamically plot support and resistance lines based on full-dollar and half-dollar price levels relative to the close price on a chart. The script is particularly useful for day traders and scalpers, as it helps visualize key psychological price levels that often act as support and resistance zones in volatile and fast-moving markets in real time.
Key Features:
Dynamic Resistance and Support Levels:
Extend Lines:
Custom Line Extension:
Color-Coded Lines:
Line Flexibility:
Nearest Full Dollar Plot:
Benefits in Day Trading, Scalping, and Volatile Markets:
Visualizing Key Psychological Levels:
Improved Decision-Making:
Adaptability to Market Conditions:
Better Risk Management:
This script is especially valuable for traders looking to capitalize on quick market movements or identify key entry and exit points during market volatility.
Key Features:
Dynamic Resistance and Support Levels:
- Full-dollar levels: These are calculated by rounding the close price to the nearest full dollar and then extending the levels by adding and subtracting increments of 1 (e.g., $1, $2, $3).
- Half-dollar levels: These are calculated by adding and subtracting 0.5 increments to the nearest full-dollar price, providing additional reference points. The historical full-dollar levels remain where support and resistance may have occurred in the past.
Extend Lines:
- You can toggle whether the support and resistance lines are extended to the right, left, or both directions. This allows flexibility in projecting potential future areas of support or resistance.
Custom Line Extension:
- The user can set the number of bars (or time periods) that the support and resistance lines will extend, giving control over how long the levels remain on the chart.
Color-Coded Lines:
- Red lines represent full-dollar resistance and support levels.
- Blue lines represent half-dollar levels, making it easy to differentiate between key psychological price zones.
Line Flexibility:
- The script allows the lines to extend both left and right on the chart, making it useful for analyzing historical price action or projecting future price movements. The number of bars for extension is customizable, allowing for tailored setups.
Nearest Full Dollar Plot:
- The nearest full-dollar price level is plotted as a yellow circle on the chart. This serves as a quick visual cue for traders to monitor price proximity to critical levels.
Benefits in Day Trading, Scalping, and Volatile Markets:
Visualizing Key Psychological Levels:
- Full-dollar and half-dollar price levels often act as psychological barriers for traders. This script helps traders easily identify these levels, which are important in both fast-moving markets and during sideways consolidation.
Improved Decision-Making:
- By automatically drawing these support and resistance levels, the script helps day traders and scalpers make quicker and more informed decisions, especially in volatile markets where every second counts.
Adaptability to Market Conditions:
- The flexibility of extending lines based on trader preferences allows the user to adapt the script to various market conditions, such as high volatility or trend-based trading, providing a clear view of potential breakout or reversal areas.
Better Risk Management:
- Having predefined support and resistance levels helps traders better manage risk, as these levels can act as logical areas for setting stop losses or taking profits.
This script is especially valuable for traders looking to capitalize on quick market movements or identify key entry and exit points during market volatility.
Notas de prensa
This updated script introduces a multiplier-based approach to dynamically calculate and display support and resistance levels. The addition of the levelMultiplier input allows users to specify the granularity of price levels, making the script versatile for assets with vastly different price ranges and movements.- Adaptability Across Asset Classes:
The levelMultiplier accommodates assets with large values (e.g., Bitcoin or high-value stocks) by allowing users to define significant levels, such as increments of $10,000 for Bitcoin. Similarly, it supports low-value stocks or penny stocks by enabling small incremental levels, such as $0.10. - Precision for Low-Priced Assets:
For penny stocks or assets with smaller price fluctuations, users can set the multiplier to values like 0.10 or 1, ensuring that resistance and support levels align with realistic movements. - Scalability for High-Priced Assets:
For larger-valued assets, such as Bitcoin or high-value commodities, users can set the multiplier to 10000 or other large increments, avoiding clutter from irrelevant minor levels and focusing on meaningful thresholds. - Customizable Granularity:
Users can fine-tune the multiplier to suit their trading strategy and the asset’s price behavior, providing greater flexibility than a fixed dollar-based system. - Enhanced Visualization:
Full and half-levels are dynamically adjusted based on the multiplier, ensuring that the plotted lines remain relevant and easy to interpret, regardless of the asset’s value range.
Example Scenarios:
- For Bitcoin:
A multiplier of 10000 creates levels at $10,000 increments (e.g., $80,000, $90,000) and mid-levels at $5,000 increments (e.g., $85,000). - For Penny Stocks:
A multiplier of 0.10 generates levels every $0.10 (e.g., $1.10, $1.20) and mid-levels at $0.05 (e.g., $1.15). - For Mid-Cap Stocks:
A multiplier of 1 provides $1 levels (e.g., $100, $101) and mid-levels at $0.50 (e.g., $100.50).
This update empowers traders to apply the same script across various markets, ensuring accurate and relevant analysis tailored to each asset’s unique price dynamics.
Notas de prensa
This updates to turn the multiplier off or on. Off is default as it was designed for stocks $20 and under. Still works great for all other commodities outside these values. Script de código abierto
Fiel al espíritu de TradingView, el creador de este script lo ha convertido en código abierto, para que los traders puedan revisar y verificar su funcionalidad. ¡Enhorabuena al autor! Aunque puede utilizarlo de forma gratuita, recuerde que la republicación del código está sujeta a nuestras Normas internas.
Exención de responsabilidad
La información y las publicaciones no constituyen, ni deben considerarse como asesoramiento o recomendaciones financieras, de inversión, de trading o de otro tipo proporcionadas o respaldadas por TradingView. Más información en Condiciones de uso.
Script de código abierto
Fiel al espíritu de TradingView, el creador de este script lo ha convertido en código abierto, para que los traders puedan revisar y verificar su funcionalidad. ¡Enhorabuena al autor! Aunque puede utilizarlo de forma gratuita, recuerde que la republicación del código está sujeta a nuestras Normas internas.
Exención de responsabilidad
La información y las publicaciones no constituyen, ni deben considerarse como asesoramiento o recomendaciones financieras, de inversión, de trading o de otro tipo proporcionadas o respaldadas por TradingView. Más información en Condiciones de uso.