PROTECTED SOURCE SCRIPT
Actualizado Higher Timeframe Candle Overlay
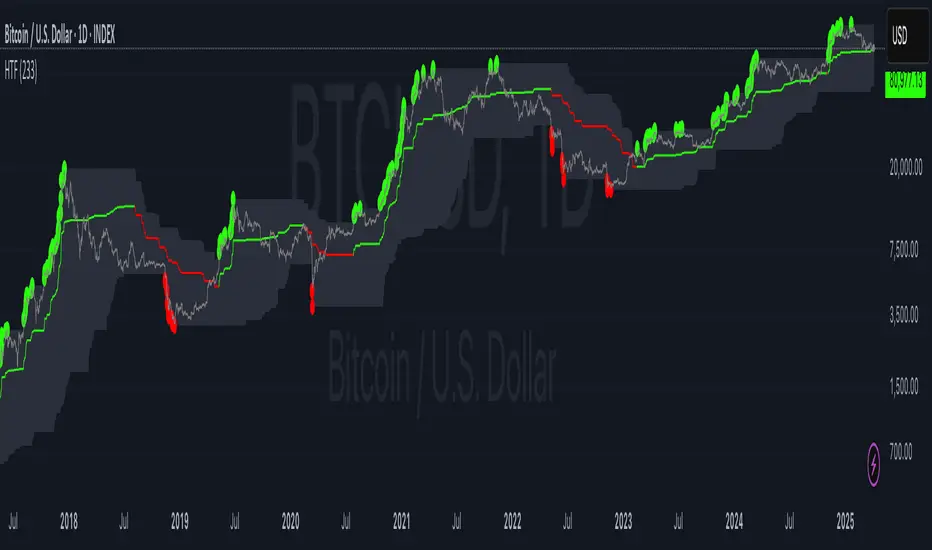
Hi all, this script helps you to see candle of any timeframe at the same time. It is possible to find the regions of dying trend by peeking into the higher timeframe candles. For example, on a 1-min chart, a 1439 min ( (24*60) - 1 ) candle is a day candle refernce to that 1-min. If huge bodied candles starts to grow larger wicks and smaller bodies, it means that the trend is dying.
Notas de prensa
- Optimised code
- Cleaned up charting
Notas de prensa
Added colouring inputDisplayed higher timeframe candle's Bullish Highs, Bearish Lows and Median price levels
Notas de prensa
- Displayed HTF Candles based areas of lower and higher prices
Notas de prensa
- Fixed typos
Notas de prensa
Updated to PineScript v6Notas de prensa
+Added colours for median lineScript protegido
Este script se publica como código cerrado. No obstante, puede utilizarlo libremente y sin ninguna limitación. Obtenga más información aquí.
Exención de responsabilidad
La información y las publicaciones no constituyen, ni deben considerarse como asesoramiento o recomendaciones financieras, de inversión, de trading o de otro tipo proporcionadas o respaldadas por TradingView. Más información en Condiciones de uso.
Script protegido
Este script se publica como código cerrado. No obstante, puede utilizarlo libremente y sin ninguna limitación. Obtenga más información aquí.
Exención de responsabilidad
La información y las publicaciones no constituyen, ni deben considerarse como asesoramiento o recomendaciones financieras, de inversión, de trading o de otro tipo proporcionadas o respaldadas por TradingView. Más información en Condiciones de uso.