OPEN-SOURCE SCRIPT
💻 RSI Dual-Band Reversal Strategy (Hacker Mode)
This 💻 RSI Dual-Band Reversal Strategy (Hacker Mode) is a mean-reversion trading strategy built on the Relative Strength Index (RSI) indicator.
It identifies potential trend reversals when price momentum reaches extreme overbought or oversold levels — then enters trades expecting the price to revert.
⚙️ Strategy Concept
The RSI measures market momentum on a scale of 0–100.
When RSI is too low, it signals an oversold market → potential buy.
When RSI is too high, it signals an overbought market → potential sell.
This strategy sets two reversal zones using dual RSI bands:
Zone RSI Range Meaning Action
Upper Band 80–90 Overbought Prepare to Sell
Lower Band 10–20 Oversold Prepare to Buy
🧩 Code Breakdown
1. Input Parameters
rsiLength = input.int(14)
upperBandHigh = input.float(90.0)
upperBandLow = input.float(80.0)
lowerBandLow = input.float(10.0)
lowerBandHigh = input.float(20.0)
You can adjust:
RSI Length (default 14) → sensitivity of the RSI.
Upper/Lower Bands → control when buy/sell triggers occur.
2. RSI Calculation
rsi = ta.rsi(close, rsiLength)
Calculates the RSI of the closing price over 14 periods.
3. Signal Logic
buySignal = ta.crossover(rsi, lowerBandHigh)
sellSignal = ta.crossunder(rsi, upperBandLow)
Buy Signal: RSI crosses up through 20 → market rebounding from oversold.
Sell Signal: RSI crosses down through 80 → market turning from overbought.
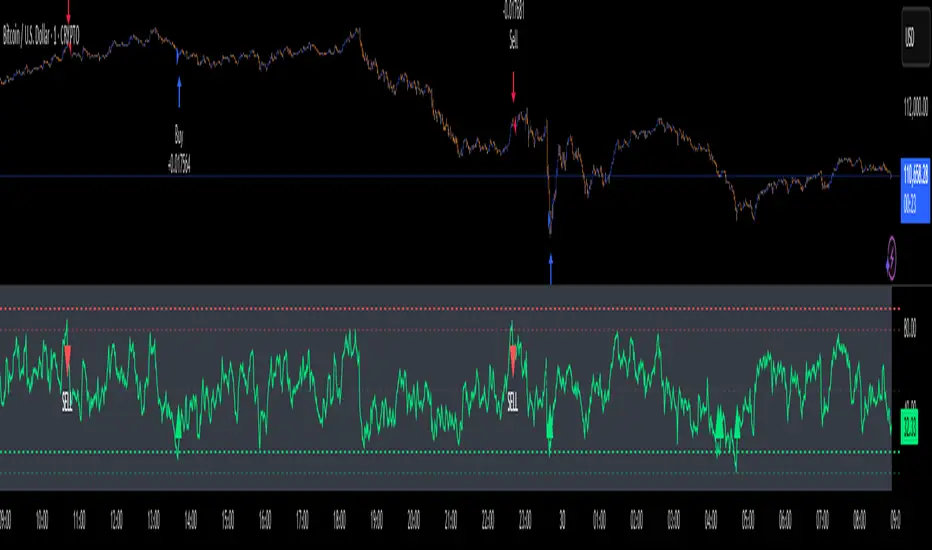
4. Plotting
RSI line (lime green)
Bands:
🔴 80–90 (Sell Zone)
🟢 10–20 (Buy Zone)
Gray midline at 50 for reference.
Triangle markers for signals:
🟢 “BUY” below chart
🔴 “SELL” above chart
5. Trading Logic
if (buySignal)
strategy.entry("Buy", strategy.long)
if (sellSignal)
strategy.entry("Sell", BTCUSD strategy.short
  XAUUSD )
Opens a long position on a buy signal.
Opens a short position on a sell signal.
No explicit stop loss or take profit — positions reverse when an opposite signal appears.
🧠 How It Works (Step-by-Step Example)
RSI drops below 20 → oversold → buy signal triggers.
RSI rises toward 80 → overbought → sell signal triggers.
Strategy flips position, always staying in the market (either long or short).
📈 Visual Summary
Imagine the RSI line oscillating between 0 and 100:
100 ────────────────────────────────
90 ───── Upper Band High (Sell Limit)
80 ───── Upper Band Low (Sell Trigger)
50 ───── Midline
20 ───── Lower Band High (Buy Trigger)
10 ───── Lower Band Low (Buy Limit)
0 ────────────────────────────────
When RSI moves above 80 → SELL
When RSI moves below 20 → BUY
⚡ Strategy Profile
Category Description
Type Mean Reversion
Entry Rule RSI crosses up 20 → Buy
Exit/Reverse Rule RSI crosses down 80 → Sell
Strengths Simple, effective in sideways/range markets, minimal lag
Weaknesses Weak in strong trends, no stop-loss or take-profit logic
💡 Suggested Improvements
You can enhance this script by adding:
Stop loss & take profit levels (e.g., % or ATR-based).
Trend filter (e.g., trade only in direction of 200 EMA).
RSI smoothing to reduce noise.
It identifies potential trend reversals when price momentum reaches extreme overbought or oversold levels — then enters trades expecting the price to revert.
⚙️ Strategy Concept
The RSI measures market momentum on a scale of 0–100.
When RSI is too low, it signals an oversold market → potential buy.
When RSI is too high, it signals an overbought market → potential sell.
This strategy sets two reversal zones using dual RSI bands:
Zone RSI Range Meaning Action
Upper Band 80–90 Overbought Prepare to Sell
Lower Band 10–20 Oversold Prepare to Buy
🧩 Code Breakdown
1. Input Parameters
rsiLength = input.int(14)
upperBandHigh = input.float(90.0)
upperBandLow = input.float(80.0)
lowerBandLow = input.float(10.0)
lowerBandHigh = input.float(20.0)
You can adjust:
RSI Length (default 14) → sensitivity of the RSI.
Upper/Lower Bands → control when buy/sell triggers occur.
2. RSI Calculation
rsi = ta.rsi(close, rsiLength)
Calculates the RSI of the closing price over 14 periods.
3. Signal Logic
buySignal = ta.crossover(rsi, lowerBandHigh)
sellSignal = ta.crossunder(rsi, upperBandLow)
Buy Signal: RSI crosses up through 20 → market rebounding from oversold.
Sell Signal: RSI crosses down through 80 → market turning from overbought.
4. Plotting
RSI line (lime green)
Bands:
🔴 80–90 (Sell Zone)
🟢 10–20 (Buy Zone)
Gray midline at 50 for reference.
Triangle markers for signals:
🟢 “BUY” below chart
🔴 “SELL” above chart
5. Trading Logic
if (buySignal)
strategy.entry("Buy", strategy.long)
if (sellSignal)
strategy.entry("Sell",
Opens a long position on a buy signal.
Opens a short position on a sell signal.
No explicit stop loss or take profit — positions reverse when an opposite signal appears.
🧠 How It Works (Step-by-Step Example)
RSI drops below 20 → oversold → buy signal triggers.
RSI rises toward 80 → overbought → sell signal triggers.
Strategy flips position, always staying in the market (either long or short).
📈 Visual Summary
Imagine the RSI line oscillating between 0 and 100:
100 ────────────────────────────────
90 ───── Upper Band High (Sell Limit)
80 ───── Upper Band Low (Sell Trigger)
50 ───── Midline
20 ───── Lower Band High (Buy Trigger)
10 ───── Lower Band Low (Buy Limit)
0 ────────────────────────────────
When RSI moves above 80 → SELL
When RSI moves below 20 → BUY
⚡ Strategy Profile
Category Description
Type Mean Reversion
Entry Rule RSI crosses up 20 → Buy
Exit/Reverse Rule RSI crosses down 80 → Sell
Strengths Simple, effective in sideways/range markets, minimal lag
Weaknesses Weak in strong trends, no stop-loss or take-profit logic
💡 Suggested Improvements
You can enhance this script by adding:
Stop loss & take profit levels (e.g., % or ATR-based).
Trend filter (e.g., trade only in direction of 200 EMA).
RSI smoothing to reduce noise.
Script de código abierto
Siguiendo fielmente el espíritu de TradingView, el creador de este script lo ha publicado en código abierto, permitiendo que otros traders puedan revisar y verificar su funcionalidad. ¡Enhorabuena al autor! Puede utilizarlo de forma gratuita, pero tenga en cuenta que la publicación de este código está sujeta a nuestras Normas internas.
Exención de responsabilidad
La información y las publicaciones que ofrecemos, no implican ni constituyen un asesoramiento financiero, ni de inversión, trading o cualquier otro tipo de consejo o recomendación emitida o respaldada por TradingView. Puede obtener información adicional en las Condiciones de uso.