OPEN-SOURCE SCRIPT
Actualizado HTF Candle Boxes for LTF Charts
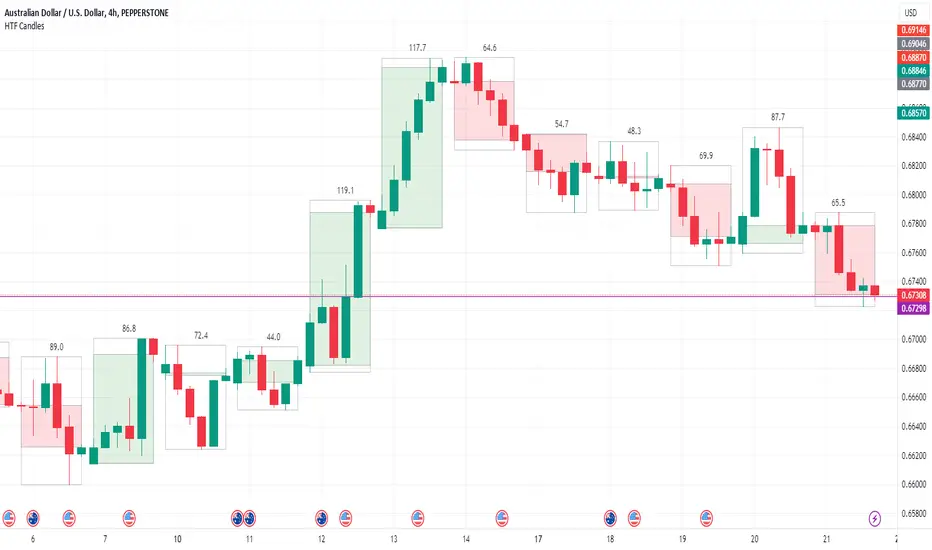
This indicator allows you to show an outline of a Higher Time Frame (HTF) candle on a Lower Time Frame (LTF) chart. Options include selecting the HTF interval, and an option to either show a single shaded Box for the candle (High to Low), or a shaded box for the body (Open to Close) with the High to Low shown in an unshaded box. The purpose is to easily visualise what the previous HTF candles look like as you are working on the lower charts, for example was yesterday's candle Bullish, Bearsish, indecision, a Doji etc.
Notas de prensa
Added the option to not paint the current HTF bar, default is not Notas de prensa
This version cleans up the painting of the last candle as previously it would create multiple boxes on each new candle if in real-time. Also added is the optional inclusion to show the Pip-Range of the HTF candle.
Notas de prensa
v4 10-Dec-23 - minor fix - occasionally the HTF box was paniting the wrong colour (for Doji-type Candles) because it was looking at the current candle rather than the last candle for that box. Notas de prensa
Version 5 - 26-Dec-24 Coverted to Pine V6, Fixed issues with the last candle update, added option for Mid-Line, reorganised the menu.
KNOWN ISSUE -- This does not work with non-divisble timeframes. The LTF candle open and close dictates the HTF data. For example a 2min chart with a 5min HTF. Because the M5 changes halfway through a M2 candle, you will end up with a series of 2 bar then 3 bar HTF candles. Simarly a weekly chart with a Monthly HTF because a month may end mid-week (not divisible)
Script de código abierto
Siguiendo fielmente el espíritu de TradingView, el creador de este script lo ha publicado en código abierto, permitiendo que otros traders puedan revisar y verificar su funcionalidad. ¡Enhorabuena al autor! Puede utilizarlo de forma gratuita, pero tenga en cuenta que la publicación de este código está sujeta a nuestras Normas internas.
Exención de responsabilidad
La información y las publicaciones que ofrecemos, no implican ni constituyen un asesoramiento financiero, ni de inversión, trading o cualquier otro tipo de consejo o recomendación emitida o respaldada por TradingView. Puede obtener información adicional en las Condiciones de uso.