INVITE-ONLY SCRIPT
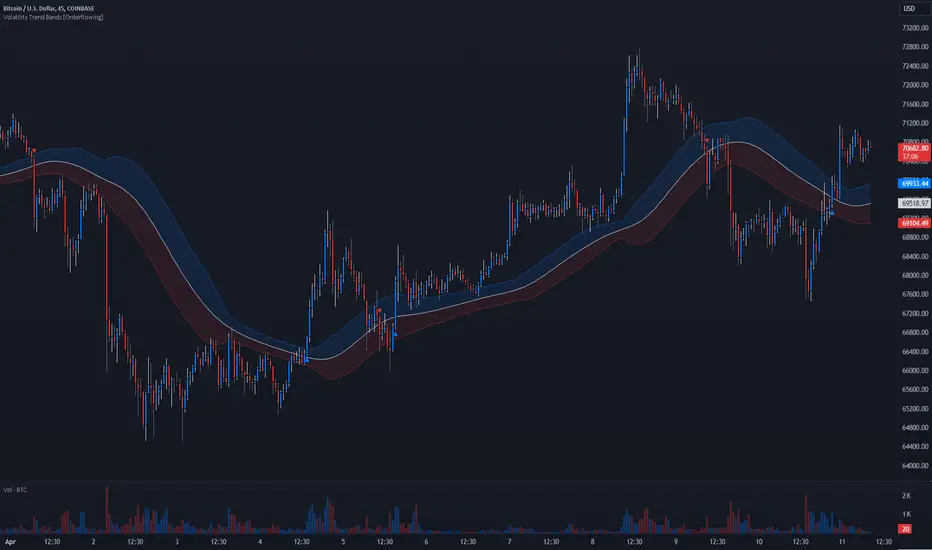
Volatility Trend Bands [Orderflowing]
Actualizado

Volatility Trend Bands | Moving Averages | Adaptive Bands | Volatility | Smoothing (+)
Built using Pine Script V5.
Introduction
The Volatility Trend Bands indicator is a trading tool designed for trend analysis and market volatility visualization.
It integrates multiple moving average types, offering traders a customizable trend visual.
Inspiration and Originality
The Volatility Trend Bands indicator is inspired by the need for a comprehensive trend/volatility tool that can work with differing market conditions and trading styles.
Its use of multiple moving average types and more customizable settings sets it apart from other traditional technical analysis tools.
Core Features
Input Parameters
Example of Disabled Smoothing (EMA type):

Example of Enabled Smoothing (EMA type):

Example of T3 Calculation:

Example of Multi-Timeframe (1D Calculation / 4H Chart):

Usage and Applications
The Value
The Volatility Trend Bands indicator is a custom tool, offering advanced features and customization options that justify its value.
Conclusion
The Volatility Trend Bands indicator is a useful tool for market analysis, offering a mix of advanced calculation methods and customization options.
It adapts to market conditions and trader preferences, providing a flexible approach to trend analysis.
The Volatility Trend Bands indicator is to be used for confluence with other trading strategies and market analysis methods.
Only relying on this indicator for trading decisions is not advised.
Built using Pine Script V5.
Introduction
The Volatility Trend Bands indicator is a trading tool designed for trend analysis and market volatility visualization.
It integrates multiple moving average types, offering traders a customizable trend visual.
Inspiration and Originality
The Volatility Trend Bands indicator is inspired by the need for a comprehensive trend/volatility tool that can work with differing market conditions and trading styles.
Its use of multiple moving average types and more customizable settings sets it apart from other traditional technical analysis tools.
Core Features
- Multiple Moving Average Types: Offers EMA, DEMA, T3, Laguerre, ZLEMA, TEMA, or HULL types for the calculation.
- Band Width: Allows for the adjustment of band width, used to align it with different analytical styles and volatility levels.
- Optional Smoothing: Implements smoothing techniques for a clearer view of the Trend Band, reducing market noise and take significant movements into account.
- Calculations: Includes options like Laguerre Gamma and Volume Factor for T3, allowing depth for the Laguerre & T3 options.
Input Parameters
- Lookback Period: Adjust the number of past data points considered, affecting sensitivity to market changes.
- Moving Average Type: Select from the available options to determine the band's calculation method.
- Band Width Multiplier: Modify the width of the bands to visualize market extremes and volatility more effectively.
- Smoothing Techniques: Choose to apply smoothing for a trend visualization.
- Calculation Settings: Fine-tune settings like Laguerre Gamma and Volume Factor.
Example of Disabled Smoothing (EMA type):
Example of Enabled Smoothing (EMA type):
Example of T3 Calculation:
Example of Multi-Timeframe (1D Calculation / 4H Chart):
Usage and Applications
- Instrument Trend Analysis: The plotted trend can be used to analyze trends and potential reversal points, helping with strategic decision-making.
- Volatility: Offers visual of market volatility, and furthermore in the identification of potential breakout points.
- Risk Management: Utilize the bands for setting strategic stop-loss or take-profit levels, based on nuanced market movement analysis.
The Value
The Volatility Trend Bands indicator is a custom tool, offering advanced features and customization options that justify its value.
Conclusion
The Volatility Trend Bands indicator is a useful tool for market analysis, offering a mix of advanced calculation methods and customization options.
It adapts to market conditions and trader preferences, providing a flexible approach to trend analysis.
The Volatility Trend Bands indicator is to be used for confluence with other trading strategies and market analysis methods.
Only relying on this indicator for trading decisions is not advised.
Notas de prensa
V1.1 - Added Multiplier Band Type, Additional Smoothing Options & Signals for Crossover.Notas de prensa
V1.2 - Fixed Additional Smoothing FunctionNotas de prensa
V1.3 - Updated Crossover LogicNotas de prensa
V1.3.1 - Added "percent" option for bands width.Script que requiere invitación
El acceso a este script está restringido a los usuarios autorizados por el autor y, por regla general, es de pago. Puede añadirlo a sus favoritos, pero solo podrá usarlo si solicita permiso al autor y éste le autoriza. Para obtener más información, póngase en contacto con Orderflowing o siga las siguientes instrucciones del autor.
TradingView recomienda no comprar ni utilizar un script si su autor no le ofrece total confianza o cuando no entienda cómo funciona. En muchos casos, puede encontrar una buena alternativa de código abierto de forma gratuita en nuestros Scripts de la comunidad.
Instrucciones del autor
″To start using this script, please visit our site: https://orderflowing.com for access.
¿Quiere utilizar este script en un gráfico?
Advertencia: Por favor, leer antes de solicitar acceso.
William | Orderflowing
Develop Edge For Markets™
Indicators:
tradingview.com/u/Orderflowing/
orderflowing.com/indicators
Get Instant Access: orderflowing.com/pricing
Develop Edge For Markets™
Indicators:
tradingview.com/u/Orderflowing/
orderflowing.com/indicators
Get Instant Access: orderflowing.com/pricing
Exención de responsabilidad
La información y las publicaciones que ofrecemos, no implican ni constituyen un asesoramiento financiero, ni de inversión, trading o cualquier otro tipo de consejo o recomendación emitida o respaldada por TradingView. Puede obtener información adicional en las Condiciones de uso.