OPEN-SOURCE SCRIPT
Actualizado DeQuex Algo
Hello everyone,
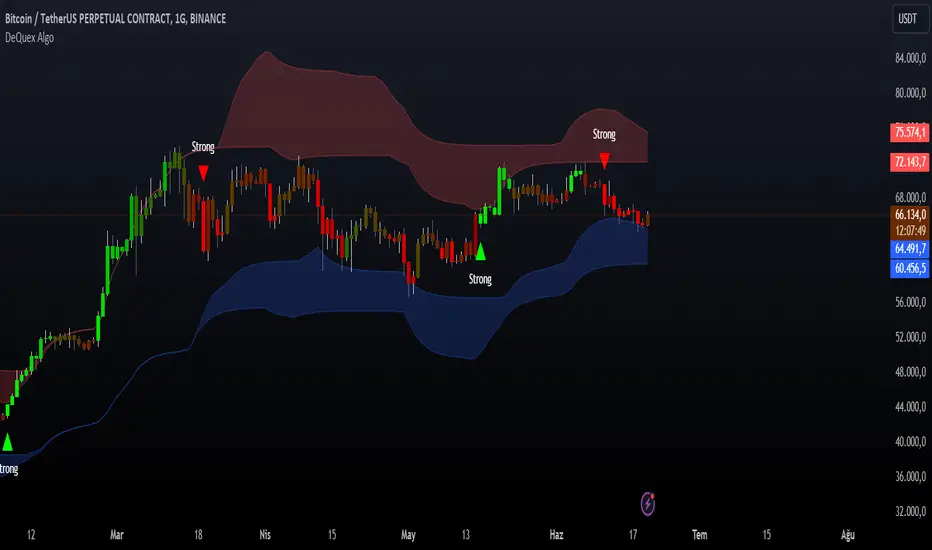
This indicator uses MACD and RSI, to show buy and sell signals.
Signal Features:
You can set up an alarm for each signal type.
Best regards,
BrandonJames1337
This indicator uses MACD and RSI, to show buy and sell signals.
Signal Features:
- Buy Signal: Chart gives a buy signal when the MACD crosses above.
- Sell Signal: Chart gives a sell signal when the MACD crosses down.
- Strong Buy Signal: Chart gives a strong buy signal when the MACD and RSI cross above.
- Storng Sell Signal: Chart gives a strong sell signal when the MACD and RSI cross down.
- Highligh Price Bars: This option is enabled by default, it shows the trend colored for easy understanding of the trend. Green bars mean the trend is going up, Red bars means the trend is going down and, the last one is purple bars they are means that unknown trend so you can understand for example if the purple bar has happened on the green trend you can understand the trend power slowly decrease.
You can set up an alarm for each signal type.
Best regards,
BrandonJames1337
Notas de prensa
- Signal shapes now editable.
- Some size adjustments on signal shapes.
Notas de prensa
Default signal smooth settings changed to mid-term. (Old smooth setting is renamed as short term.)Recommended Short, Mid and Long term signal smoothing values added as tooltip.
Notas de prensa
Default color update.Notas de prensa
Alert names changed.Notas de prensa
Code cleanup and more readabilityNotas de prensa
Updated default signal smoothing valueNotas de prensa
Changelog:- Added a new input option called "Filter Signals by Support/Resistance" under the "Signal Settings" group. This option allows users to toggle the signal filter on or off based on the support and resistance lines.
- Modified the plotshape functions for "Strong Buy", "Strong Sell", "Buy", and "Sell" signals to take the new signalFilter input into account. When the filter is enabled, the signals will only be displayed if the price is above the support line for buy signals and below the resistance line for sell signals. When the filter is disabled, all signals will be displayed regardless of their position relative to the support and resistance lines.
- Implemented dynamic support and resistance levels based on the volume trend using the trail length and multiplier input values.
- Added the trail support and resistance calculations to the script, which take into account the volume trend (OBV) to adjust the support and resistance levels.
- Plotted the dynamic support and resistance levels based on the calculated trail support and resistance values.
Notas de prensa
Exit signals added as take profit.Notas de prensa
removed unnecessary codeNotas de prensa
bug fix on exit signalsNotas de prensa
exit signals agility added, to see more exit signals less efficient you can lower the agility from settingsNotas de prensa
Added alerts for exit signalsNotas de prensa
exit signal defaul value updated and changeable from inputboxNotas de prensa
Improved- Refactored code for better readability and ease of maintenance.
- Moved the decision logic for choosing the moving average from the security function for cleaner code.
- Optimized computation of moving averages within the security() function, improving script performance.
Fixed
- Resolved issues that occurred when switching between SMA and EMA during runtime.
Please always ensure to have the most recent version of this script for the best performance and the latest features. Feel free to provide feedback or report issues.
Notas de prensa
Change Log:- Added support and resistance zones to the DeQuex Algo indicator:
and resistance zones: original and precise.
Implemented dynamic support and resistance zones to identify potential reversal points in price action.
Utilized volatility-based calculations to determine the upper and lower boundaries of the zones.
Provided users with the flexibility to choose between two methods for calculating support - Enhanced trend detection and visualization:
Improved the accuracy of trend detection by refining the logic for identifying bullish, bearish, and consolidating trends.
Updated the color scheme for trend detection to provide clearer visual cues:
Green: Bullish trend
Red: Bearish trend
Purple: Consolidating trend
Applied the enhanced trend colors to the price bars for better readability and trend recognition. - Optimized and refactored the indicator codebase:
- Restructured the code to improve readability, maintainability, and performance.
- Removed redundant calculations and streamlined the logic for improved efficiency.
- Added clear and concise comments throughout the code to enhance understanding and facilitate future modifications.
- Restructured the code to improve readability, maintainability, and performance.
Notas de prensa
code cleanupNotas de prensa
Changelog:- Added new input parameters for configuring the periods used in the calculation of support and resistance levels:
- `supportLevelinput`: Input parameter to set the period for calculating the support level (default: 20).
- `resistanceLevelinput`: Input parameter to set the period for calculating the resistance level (default: 20).
- `preciseSupportZoneEndinput`: Input parameter to set the period for calculating the precise support zone end (default: 50).
- `preciseResistanceZoneStartinput`: Input parameter to set the period for calculating the precise resistance zone start (default: 50).
- Updated the calculation of `supportLevel`, `resistanceLevel`, `preciseSupportZoneEnd`, and `preciseResistanceZoneStart` to use the newly added input parameters.
- Changed the default value of `macd_signal_ema` from 10 to 12.
- Removed the "Original" option for support and resistance zone calculation.
- Removed the `zonePrecision` input parameter and related code for selecting the zone precision.
- Removed the `supportZoneStart`, `supportZoneEnd`, `resistanceZoneStart`, `resistanceZoneEnd`, and `finalSupport/ResistanceZoneStart/End` variables.
- Now using the "Precise" support and resistance zone calculation method exclusively.
- Replaced the usage of the removed variables with the `preciseSupportZoneStart`, `preciseSupportZoneEnd`, `preciseResistanceZoneStart`, and `preciseResistanceZoneEnd` variables.
Notas de prensa
Change bar color based on MACD histogram power and RSI signalNotas de prensa
- Gradient colors added as trend colors.
- Groups re-adjusted.
Script de código abierto
Fiel al espíritu de TradingView, el creador de este script lo ha convertido en código abierto, para que los traders puedan revisar y verificar su funcionalidad. ¡Enhorabuena al autor! Aunque puede utilizarlo de forma gratuita, recuerde que la republicación del código está sujeta a nuestras Normas internas.
Exención de responsabilidad
La información y las publicaciones no pretenden ser, ni constituyen, asesoramiento o recomendaciones financieras, de inversión, de trading o de otro tipo proporcionadas o respaldadas por TradingView. Más información en Condiciones de uso.