OPEN-SOURCE SCRIPT
Steinkopff Steigung
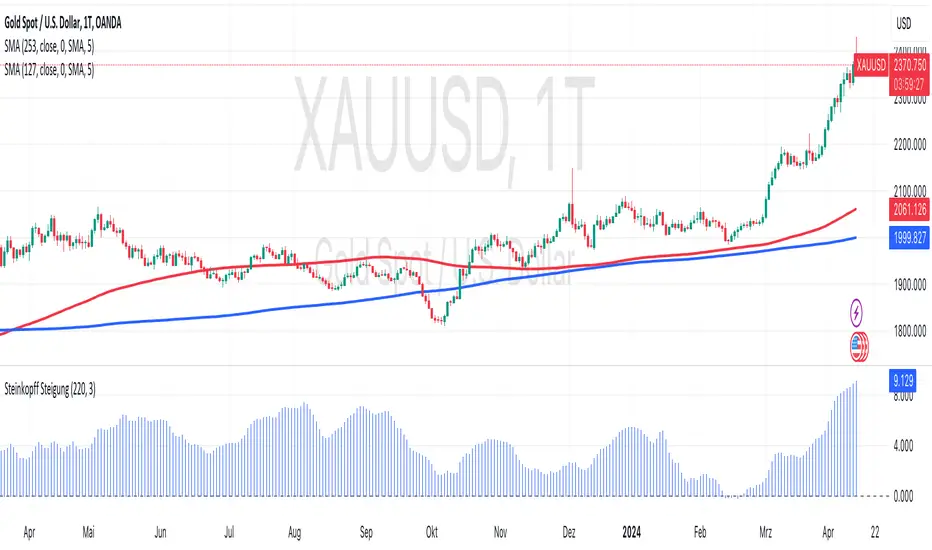
The "Steinkopff Slope" indicator is a custom tool for TradingView designed to measure and visually represent the percentage slope of a moving average. This indicator is particularly useful for analyzing the momentum of a financial instrument by highlighting changes in the slope of the moving average.
Initially, the indicator allows the user to define the length of the moving average to be used as the basis for the calculation. This input is set to 220 periods by default but can be adjusted according to the user's preference. The moving average itself is calculated based on the closing prices.
The core functionality of the indicator is to calculate the percentage slope of the moving average. This is achieved by determining the change in the moving average between the current period and the previous period and expressing this change relative to the value of the previous period. The result is then scaled by a factor of 10,000 to derive a percentage slope.
To refine the results and smooth out potential outliers, the indicator additionally performs a smoothing of the calculated slope. The user can adjust the length of this smoothing through another input parameter, which is set to 3 periods by default. The smoothed slope is finally displayed as a histogram in blue, with the line thickness set to 1.
A horizontal line at zero (displayed in gray) serves as a reference point to visually distinguish between positive and negative slopes. This helps traders and analysts identify trends: a slope above the zero line indicates a positive trend, while a slope below the zero line signals a negative trend.
In summary, the "Steinkopff Slope" indicator provides a simple yet effective way to understand the momentum and direction of a trend by analyzing and visualizing changes in the slope of a moving average over a definable period.
Script de código abierto
Fiel al espíritu de TradingView, el creador de este script lo ha convertido en código abierto, para que los traders puedan revisar y verificar su funcionalidad. ¡Enhorabuena al autor! Aunque puede utilizarlo de forma gratuita, recuerde que la republicación del código está sujeta a nuestras Normas internas.
Exención de responsabilidad
La información y las publicaciones no constituyen, ni deben considerarse como asesoramiento o recomendaciones financieras, de inversión, de trading o de otro tipo proporcionadas o respaldadas por TradingView. Más información en Condiciones de uso.