OPEN-SOURCE SCRIPT
Advanced Directional Stoch RSI
Advanced Directional Stochastic RSI
Overview
The Advanced Directional Stochastic RSI (Adv Stoch RSI Dir) is a powerful oscillator that combines the classic Stochastic RSI with John Ehlers' SuperSmoother filter for ultra-smooth signals and reduced noise. Unlike traditional Stoch RSI, this indicator incorporates directional coloring based on price action relative to a smoothed trend line, helping traders quickly spot bullish or bearish momentum. It's designed for swing traders and scalpers looking for clearer overbought/oversold conditions in volatile markets.
Key Features
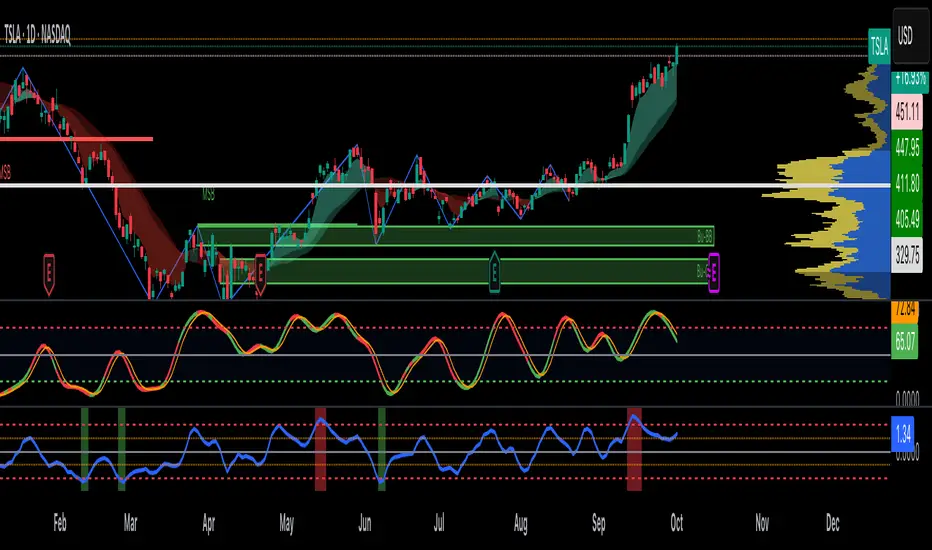
Directional Coloring: %K line turns green when price is above the trend MA (bullish) and red when below (bearish), providing instant visual bias.
Multi-Pass SuperSmoothing: Apply Ehlers' SuperSmoother filter up to 5 times for customizable noise reduction—dial in passes (default: 2) to balance responsiveness and smoothness.
Trend-Aware Baseline: Uses a cascaded smoothed moving average (default length: 20) to gauge overall direction, making the oscillator more context-aware.
Classic Stoch RSI Core: Built on RSI (default: 14) and Stochastic (default: 14), with SMA smoothing for %K (3) and %D (3).
Visual Aids: Includes overbought (80), oversold (20), and midline (50) levels, plus a subtle blue fill between OB/OS zones for easy reference.
How It Works
Source Smoothing: The input source (default: close) is passed through the SuperSmoother filter multiple times to create a trend MA.
Stoch RSI Calculation: Computes RSI on the source, then applies Stochastic to the RSI values, followed by SMA smoothing for base %K and %D.
Advanced Smoothing: Extra SuperSmoother layers are applied to %K and %D based on your chosen passes, minimizing whipsaws.
Directional Logic: Compares current close to the trend MA to color %K dynamically.
Plotting: %K (thick line, colored) and %D (thin orange) oscillate between 0-100, highlighting crossovers and divergences.
Usage Tips
Buy Signal: Green %K crosses above %D below 50, or bounces off oversold (20) in uptrends.
Sell Signal: Red %K crosses below %D above 50, or rejects overbought (80) in downtrends.
Customization: Increase smoothing passes (3-5) for choppy markets; reduce for faster signals. Pair with volume or support/resistance for confirmation.
Timeframes: Best on 1H-4H charts for stocks/crypto; adjust lengths for forex.
This open-source script is licensed under Mozilla Public License 2.0. Backtest thoroughly—past performance isn't indicative of future results. Enjoy trading smarter with less noise! 🚀
© HighlanderOne
Overview
The Advanced Directional Stochastic RSI (Adv Stoch RSI Dir) is a powerful oscillator that combines the classic Stochastic RSI with John Ehlers' SuperSmoother filter for ultra-smooth signals and reduced noise. Unlike traditional Stoch RSI, this indicator incorporates directional coloring based on price action relative to a smoothed trend line, helping traders quickly spot bullish or bearish momentum. It's designed for swing traders and scalpers looking for clearer overbought/oversold conditions in volatile markets.
Key Features
Directional Coloring: %K line turns green when price is above the trend MA (bullish) and red when below (bearish), providing instant visual bias.
Multi-Pass SuperSmoothing: Apply Ehlers' SuperSmoother filter up to 5 times for customizable noise reduction—dial in passes (default: 2) to balance responsiveness and smoothness.
Trend-Aware Baseline: Uses a cascaded smoothed moving average (default length: 20) to gauge overall direction, making the oscillator more context-aware.
Classic Stoch RSI Core: Built on RSI (default: 14) and Stochastic (default: 14), with SMA smoothing for %K (3) and %D (3).
Visual Aids: Includes overbought (80), oversold (20), and midline (50) levels, plus a subtle blue fill between OB/OS zones for easy reference.
How It Works
Source Smoothing: The input source (default: close) is passed through the SuperSmoother filter multiple times to create a trend MA.
Stoch RSI Calculation: Computes RSI on the source, then applies Stochastic to the RSI values, followed by SMA smoothing for base %K and %D.
Advanced Smoothing: Extra SuperSmoother layers are applied to %K and %D based on your chosen passes, minimizing whipsaws.
Directional Logic: Compares current close to the trend MA to color %K dynamically.
Plotting: %K (thick line, colored) and %D (thin orange) oscillate between 0-100, highlighting crossovers and divergences.
Usage Tips
Buy Signal: Green %K crosses above %D below 50, or bounces off oversold (20) in uptrends.
Sell Signal: Red %K crosses below %D above 50, or rejects overbought (80) in downtrends.
Customization: Increase smoothing passes (3-5) for choppy markets; reduce for faster signals. Pair with volume or support/resistance for confirmation.
Timeframes: Best on 1H-4H charts for stocks/crypto; adjust lengths for forex.
This open-source script is licensed under Mozilla Public License 2.0. Backtest thoroughly—past performance isn't indicative of future results. Enjoy trading smarter with less noise! 🚀
© HighlanderOne
Script de código abierto
Fiel al espíritu de TradingView, el creador de este script lo ha convertido en código abierto, para que los traders puedan revisar y verificar su funcionalidad. ¡Enhorabuena al autor! Aunque puede utilizarlo de forma gratuita, recuerde que la republicación del código está sujeta a nuestras Normas internas.
Exención de responsabilidad
La información y las publicaciones no constituyen, ni deben considerarse como asesoramiento o recomendaciones financieras, de inversión, de trading o de otro tipo proporcionadas o respaldadas por TradingView. Más información en Condiciones de uso.