OPEN-SOURCE SCRIPT
Major & Modern Wars Timeline
Description:
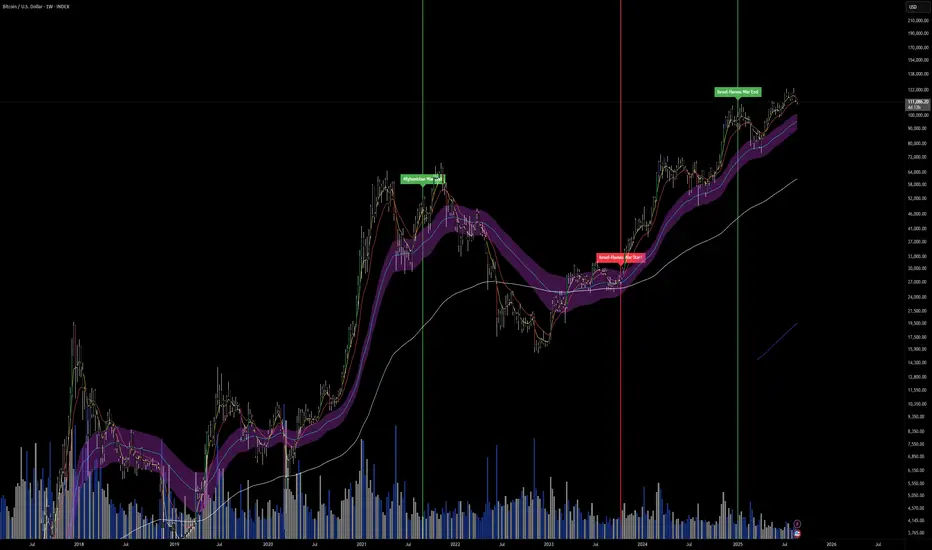
This indicator overlays vertical lines and labels on your chart to mark the start and end dates of major global wars and modern conflicts.
Features:
Displays start (red line + label) and end (green line + label) for each war.
Covers 20th century wars (World War I, World War II, Korean War, Vietnam War, Gulf War, Afghanistan, Iraq).
Includes modern conflicts: Syrian Civil War, Ukraine War, and Israel–Hamas War.
For ongoing conflicts, the end date is set to 2025 for timeline visualization.
Customizable: label position (above/below bar), line width.
Works on any chart timeframe, overlaying events on financial data.
Use case:
Useful for historical market analysis (e.g., gold, oil, S&P 500), helping traders and researchers see how wars and conflicts align with market movements.
Script de código abierto
In true TradingView spirit, the creator of this script has made it open-source, so that traders can review and verify its functionality. Kudos to the author! While you can use it for free, remember that republishing the code is subject to our House Rules.
Exención de responsabilidad
The information and publications are not meant to be, and do not constitute, financial, investment, trading, or other types of advice or recommendations supplied or endorsed by TradingView. Read more in the Terms of Use.