OPEN-SOURCE SCRIPT
HT: Weekly Levels
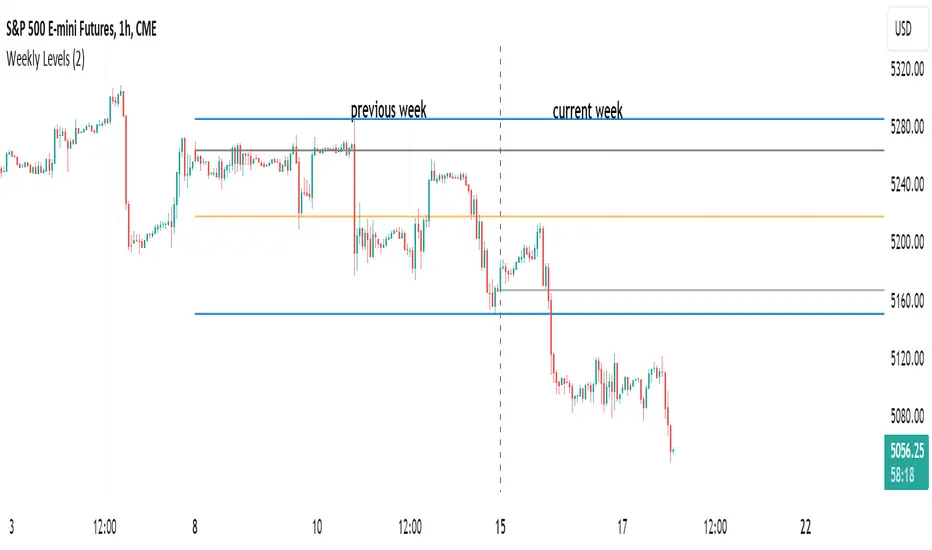
Indicator draws several most important weekly levels on the lower timeframe: last week high/low, halfback, week close and current week open. These levels often act as support/resistance for price movements. Also, they can help to assess week character and control of power.
Indicator can be used on any timeframe, lower than weekly, for any type of instrument, including futures. It also provides an option to draw levels for any selected week back in time.
Important notes:
• Levels for the last week are drawn after the new week opens.
• Half-back is calculated as a middle line between week High and Low.
Parameters:
Date – user can select date, belonging to week, for which levels will be plotted. Works only if “Use” check box is on. Otherwise, levels will be plotted for the last week. (“time” value doesn’t matter; unfortunately, there is no way to hide the input box)
Time zone – your chart time zone (as UTC offset). Only needed if you use “Date” parameter.
Visuals – controls visibility and colors
Script is published as an open source. It uses two libraries: Levels Lib and Functions Lib. First one demonstrates how to work with pine-script object model and arrays. You can also reuse it in your custom scripts where there is need to construct any support/resistance levels. The second library contains some useful functions for working with time and dates.
Disclaimer
This indicator should not be used as a standalone tool to make trading decisions but only in conjunction with other technical analysis methods.
Script de código abierto
Fiel al espíritu de TradingView, el creador de este script lo ha convertido en código abierto, para que los traders puedan revisar y verificar su funcionalidad. ¡Enhorabuena al autor! Aunque puede utilizarlo de forma gratuita, recuerde que la republicación del código está sujeta a nuestras Normas internas.
Exención de responsabilidad
La información y las publicaciones no constituyen, ni deben considerarse como asesoramiento o recomendaciones financieras, de inversión, de trading o de otro tipo proporcionadas o respaldadas por TradingView. Más información en Condiciones de uso.