OPEN-SOURCE SCRIPT
Yearly Performance Table with CAGR
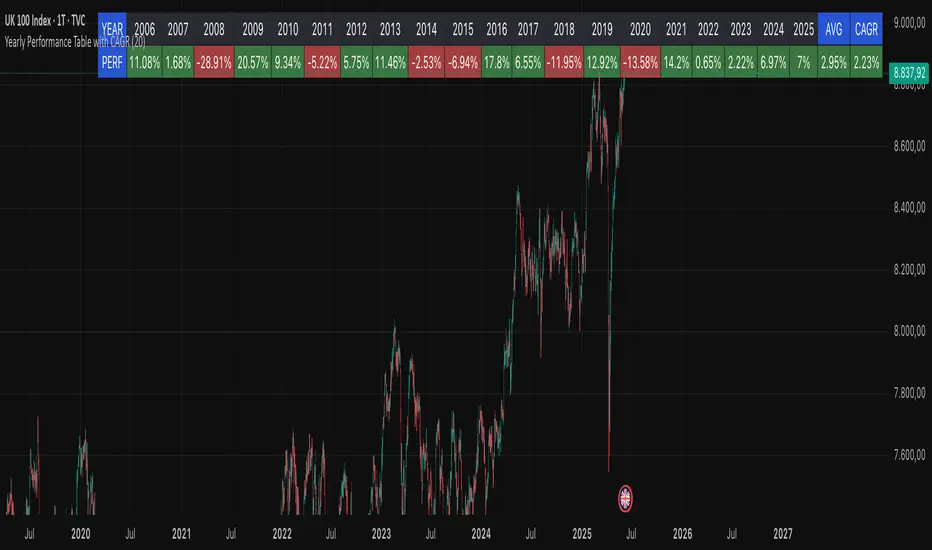
Overview
This Pine Script indicator provides a clear table displaying the annual performance of an asset, along with two different average metrics: the arithmetic mean and the geometric mean (CAGR).
Core Features
Annual Performance Calculation:
Automatically detects the first trading day of each calendar year.
Calculates the percentage return for each full calendar year.
Based on closing prices from the first to the last trading day of the respective year.
Flexible Display:
Adjustable Period: Displays data for 1-50 years (default: 10 years).
Daily Timeframe Only: Functions exclusively on daily charts.
Automatic Update: Always shows the latest available years.
Two Average Metrics:
AVG (Arithmetic Mean)
A simple average of all annual returns. (Formula: (R₁ + R₂ + ... + Rₙ) ÷ n)
Important: Can be misleading in the presence of volatile returns.
GEO (Geometric Mean / CAGR)
Compound Annual Growth Rate. (Formula: [(1+R₁) × (1+R₂) × ... × (1+Rₙ)]^(1/n) - 1)
Represents the true average annual growth rate.
Fully accounts for the compounding effect.
Limitations
Daily Charts Only: Does not work on intraday or weekly/monthly timeframes.
Calendar Year Basis: Calculations are based on calendar years, not rolling 12-month periods.
Historical Data: Dependent on the availability of historical data from the broker/data provider.
Interpretation of Results
CAGR as Benchmark: The geometric mean is more suitable for performance comparisons.
Annual Patterns: Individual year figures can reveal seasonal or cyclical trends.
Script de código abierto
Fiel al espíritu de TradingView, el creador de este script lo ha convertido en código abierto, para que los traders puedan revisar y verificar su funcionalidad. ¡Enhorabuena al autor! Aunque puede utilizarlo de forma gratuita, recuerde que la republicación del código está sujeta a nuestras Normas internas.
Exención de responsabilidad
La información y las publicaciones no constituyen, ni deben considerarse como asesoramiento o recomendaciones financieras, de inversión, de trading o de otro tipo proporcionadas o respaldadas por TradingView. Más información en Condiciones de uso.