OPEN-SOURCE SCRIPT
LEO EMA 9-13 DIFF
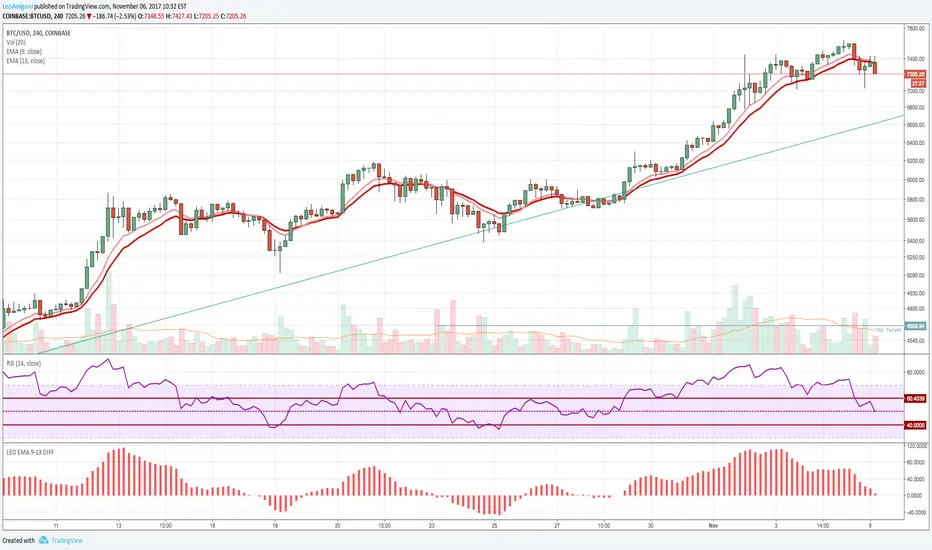
I made a public version of the private one that I made since I had so many requests.
Good indicator for buy and sell signals, better for buys usually works well on any timeframes. I use it on the 15m, 1hr, 4hr mostly.
You can plot the EMA's also on the chart to see the lines crossing but this indicator gives you a much easier read. It's very simple and basic all I do is plot the difference between the EMA 9 and the EMA 13. These values seem to give a very clear signal for entries and exits.
How to use.
- When the histogram becomes positive it's a buy signal when it becomes negative it's a sell signal.
- Note: Like any moving average this doesn't work well if you have a massive dip or a massive spike as the average will signal too late. but you should get some warning right before it happens.
Script de código abierto
Siguiendo fielmente el espíritu de TradingView, el creador de este script lo ha publicado en código abierto, permitiendo que otros traders puedan revisar y verificar su funcionalidad. ¡Enhorabuena al autor! Puede utilizarlo de forma gratuita, pero tenga en cuenta que la publicación de este código está sujeta a nuestras Normas internas.
Exención de responsabilidad
La información y las publicaciones que ofrecemos, no implican ni constituyen un asesoramiento financiero, ni de inversión, trading o cualquier otro tipo de consejo o recomendación emitida o respaldada por TradingView. Puede obtener información adicional en las Condiciones de uso.