OPEN-SOURCE SCRIPT
Actualizado Move Magnitude Visualizer (beta)
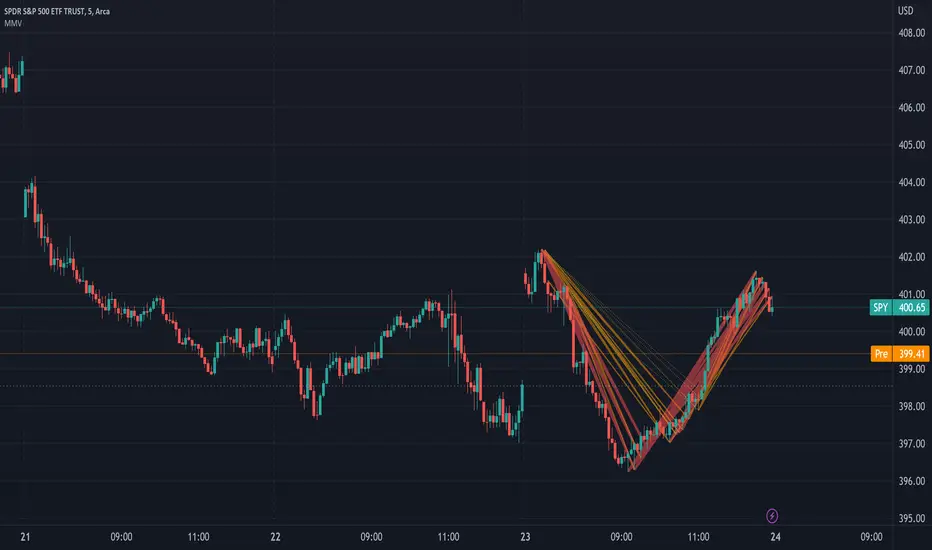
This experimental visualizer measures all price differences across a range of samples to determine what is normal for a measure of time. Based on whether a recent change in price over time has exceeded the norm, a line is drawn to indicate the magnitude/severity of that move. In short, it attempts to visualize when a move is outside the norm and when it may be risky to join that move.
In the end, I've always wanted a tool that gave me a visual warning to when a move is abnormally severe and shouldn't be trusted. RSI and other indicators only work with specific lengths, this attempt to be a deviation detector that isn't bound by length or time-frame.
- A thick red line = greater than 3 standard deviations.
- An orangish/goldish line = greater than 2 standard deviations.
- A thin dotted yellow = greater than 1 standard deviation.
In the end, I've always wanted a tool that gave me a visual warning to when a move is abnormally severe and shouldn't be trusted. RSI and other indicators only work with specific lengths, this attempt to be a deviation detector that isn't bound by length or time-frame.
- This is a work in progress, so feedback is appreciated. I don't have a strong idea yet how to properly visualize this data.
- It is very compute heavy and some users may experience timeouts. I've done everything I can think of to eliminate redundant computer and to optimize for PineScript.
Notas de prensa
Allow for custom colors.Script de código abierto
Fiel al espíritu de TradingView, el creador de este script lo ha convertido en código abierto, para que los traders puedan revisar y verificar su funcionalidad. ¡Enhorabuena al autor! Aunque puede utilizarlo de forma gratuita, recuerde que la republicación del código está sujeta a nuestras Normas internas.
Exención de responsabilidad
La información y las publicaciones no constituyen, ni deben considerarse como asesoramiento o recomendaciones financieras, de inversión, de trading o de otro tipo proporcionadas o respaldadas por TradingView. Más información en Condiciones de uso.
Script de código abierto
Fiel al espíritu de TradingView, el creador de este script lo ha convertido en código abierto, para que los traders puedan revisar y verificar su funcionalidad. ¡Enhorabuena al autor! Aunque puede utilizarlo de forma gratuita, recuerde que la republicación del código está sujeta a nuestras Normas internas.
Exención de responsabilidad
La información y las publicaciones no constituyen, ni deben considerarse como asesoramiento o recomendaciones financieras, de inversión, de trading o de otro tipo proporcionadas o respaldadas por TradingView. Más información en Condiciones de uso.