OPEN-SOURCE SCRIPT
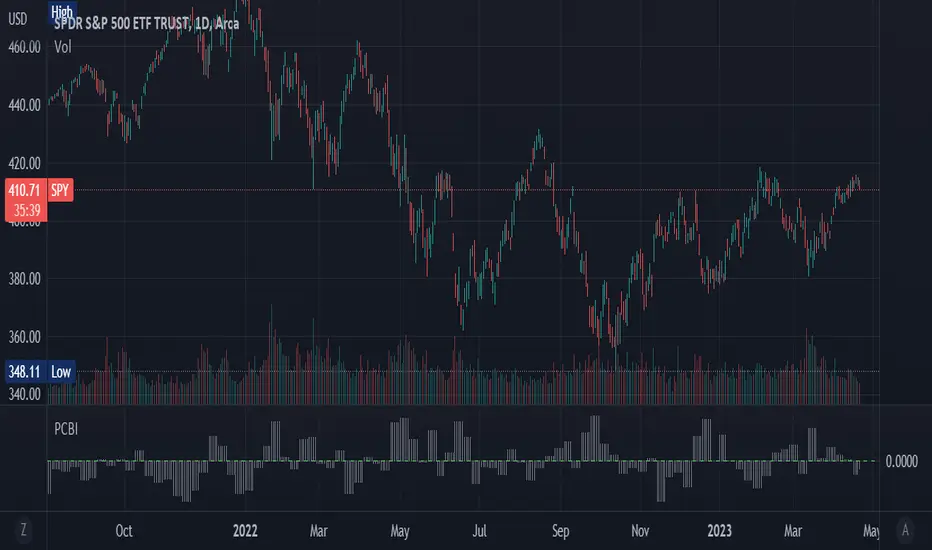
Put-Call Bias Indicator

The Put-Call Bias Indicator provides a visual representation of the relative bias towards put options using CBOE data. This script calculates the Put/All ratio, displaying the difference as compared to an even 50% ratio as columns on the chart. A positive value indicates a higher proportion of puts being bought compared to the total number of options contracts.
The indicator uses weekly CBOE data to determine the Put/Call ratio, making it suitable for analyzing longer-term trends in options trading sentiment. The gray columns represent the bias towards puts, with the green horizontal line at 0 acting as a reference point to quickly identify the prevailing bias.
In addition to providing an overview of market sentiment, this indicator can also be used as a contrarian indicator. A high Put/All ratio may suggest that the market is overly bearish, potentially signaling a bullish reversal, while a low ratio may indicate an overly bullish market, potentially pointing to a bearish reversal. Please note that this indicator should be used in conjunction with other technical analysis tools and indicators for a comprehensive understanding of the market.
(This is a new version of an old script bc previous version was deleted by TradingView; republishing with a more verbose description)
Script de código abierto
Fiel al espíritu de TradingView, el creador de este script lo ha convertido en código abierto, para que los traders puedan revisar y verificar su funcionalidad. ¡Enhorabuena al autor! Aunque puede utilizarlo de forma gratuita, recuerde que la republicación del código está sujeta a nuestras Normas internas.
Exención de responsabilidad
La información y las publicaciones no constituyen, ni deben considerarse como asesoramiento o recomendaciones financieras, de inversión, de trading o de otro tipo proporcionadas o respaldadas por TradingView. Más información en Condiciones de uso.