PROTECTED SOURCE SCRIPT
Actualizado MILLION MEN - Peaks & Dips Meter
What it is
The MILLION MEN — Peaks & Dips Meter is a dynamic momentum visualization tool designed to identify extreme strength and exhaustion zones. It uses two selectable engines:
RSI Meter (ZS Core) for classic strength analysis.
OB/OS Multi-Length (ZS Quick Core) for adaptive readings that reflect multi-period sentiment shifts.
How it works
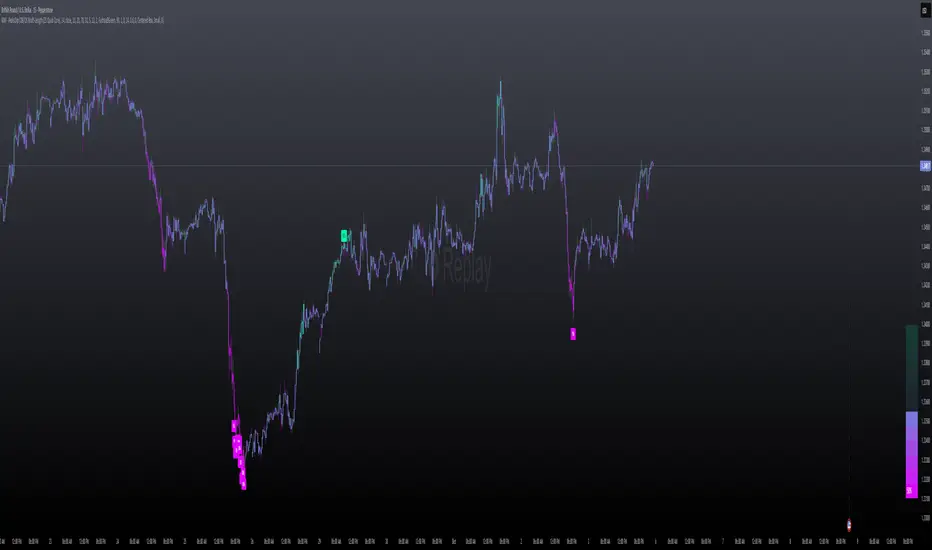
The script computes normalized momentum values (0–100) from price dynamics, builds a smooth gradient representation, and displays it as a fixed right-bottom table. The meter color scales between fuchsia and green, with optional candle coloring and percentage labels.
It can also highlight overbought (peaks) and oversold (dips) moments directly on candles with adjustable ATR offsets and label styles.
How to use
Values near 90–100% → potential short-term exhaustion (watch for reversals).
Values near 0–10% → potential accumulation zones (possible bounces).
Use together with structure, volume, or trend filters for confirmation.
Originality
Unlike standard RSI tools, this script merges multi-length OB/OS detection with a real-time visual meter, optimized for scalpers and visual traders. It does not repaint and maintains a lightweight structure for fast responsiveness.
Limitations
This indicator is for analysis purposes only and should not be considered financial advice. Past readings do not guarantee future performance.
The MILLION MEN — Peaks & Dips Meter is a dynamic momentum visualization tool designed to identify extreme strength and exhaustion zones. It uses two selectable engines:
RSI Meter (ZS Core) for classic strength analysis.
OB/OS Multi-Length (ZS Quick Core) for adaptive readings that reflect multi-period sentiment shifts.
How it works
The script computes normalized momentum values (0–100) from price dynamics, builds a smooth gradient representation, and displays it as a fixed right-bottom table. The meter color scales between fuchsia and green, with optional candle coloring and percentage labels.
It can also highlight overbought (peaks) and oversold (dips) moments directly on candles with adjustable ATR offsets and label styles.
How to use
Values near 90–100% → potential short-term exhaustion (watch for reversals).
Values near 0–10% → potential accumulation zones (possible bounces).
Use together with structure, volume, or trend filters for confirmation.
Originality
Unlike standard RSI tools, this script merges multi-length OB/OS detection with a real-time visual meter, optimized for scalpers and visual traders. It does not repaint and maintains a lightweight structure for fast responsiveness.
Limitations
This indicator is for analysis purposes only and should not be considered financial advice. Past readings do not guarantee future performance.
Notas de prensa
What it isThe MILLION MEN – Peaks & Dips Meter is a visual momentum and exhaustion detector that identifies potential overbought (peaks) and oversold (dips) zones using two selectable engines:
RSI Meter (ZS Core): Classic normalized RSI-based strength.
OB/OS Multi-Length (ZS Quick Core): Adaptive overbought/oversold logic across multiple lengths for more responsive behavior.
It renders a gradient meter (0–100) as a fixed bottom-right table and can optionally display percentage labels, highlight extreme candles, and even color bars based on meter intensity.
How it works (core logic)
The script calculates momentum by comparing directional movement (up vs. down) over single or multiple lookback lengths.
For the multi-length mode, it counts how many lengths confirm overbought/oversold conditions, then smooths the result to produce a stable reading.
The final value (0–100) is shown using a customizable vertical gradient (Fuchsia↔Green or warm palette).
Extreme zones (e.g., ≥90% or ≤10%) can trigger labels above/below candles with ATR-based offsets for clarity.
Optional candle coloring blends the gradient color directly into price bars, creating an intuitive visual map of market sentiment.
How to use
High values (peaks) → potential short-term exhaustion or reversal zones.
Low values (dips) → potential accumulation or bounce areas.
Works on any timeframe and asset.
Best used with structure, volume, or trend filters for confirmation.
Customize thresholds, label styles, meter segments, and smoothing to match your trading style.
Originality & value
Unlike standard RSI indicators, this tool introduces a multi-length OB/OS engine, a fully visual meter table, and direct candle labeling in one package. It provides real-time momentum context without repainting and is designed for scalpers, intraday traders, and visual decision-makers who want clearer exhaustion signals than a single-line oscillator.
Limitations & transparency
This indicator does not predict direction on its own; it highlights momentum extremes.
Extreme readings can remain extended during strong trends.
Always combine with structure or confirmation.
No future data is used (non-repainting).
This is not financial advice.
(Optional Arabic summary below English if desired)
مؤشر Peaks & Dips Meter يعرض قوة الزخم ومناطق الإجهاد الشرائي/البيعي بطريقة مرئية عبر مقياس متدرّج 0–100.
يمكن الاعتماد عليه لاكتشاف قمم مؤقتة (تشبع شرائي) أو قيعان محتملة (تشبع بيعي) باستخدام منطق RSI الكلاسيكي أو تحليل متعدد الأطوال المتطور.
لا يعيد الرسم، ويمكن تخصيصه بالكامل من حيث الألوان، عدد الشرائح، ونمط الليبلز.
Script protegido
Este script se publica como código cerrado. No obstante, puede utilizarlo libremente y sin ninguna limitación. Obtenga más información aquí.
Exención de responsabilidad
La información y las publicaciones no constituyen, ni deben considerarse como asesoramiento o recomendaciones financieras, de inversión, de trading o de otro tipo proporcionadas o respaldadas por TradingView. Más información en Condiciones de uso.