PROTECTED SOURCE SCRIPT
Musashi_Slasher (Mometum+Volatility)

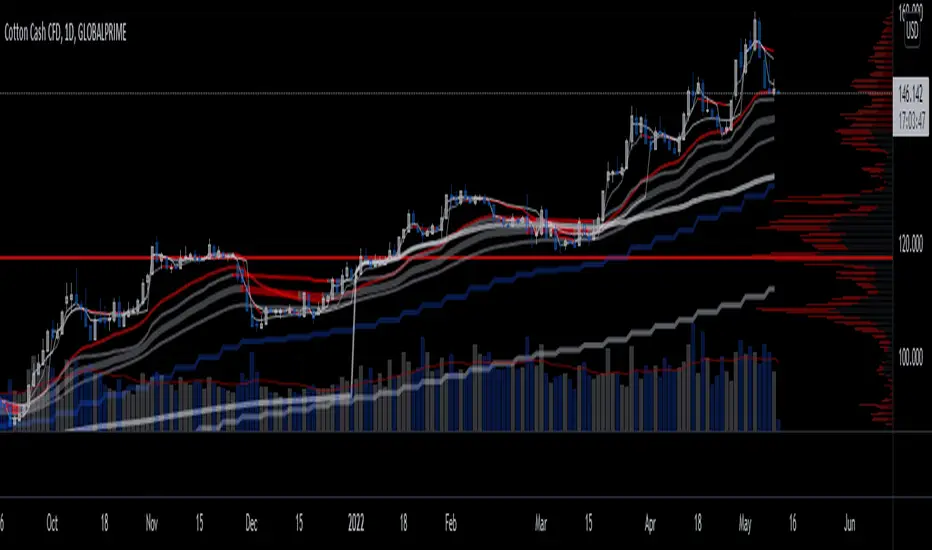
--- Musashi Slasher (Momentum + Volatility ) ---
This tool was designed to fit my particular trading style and personal theories about the "Alchemy of the markets".
Velocity
This concept will be represented by the light blue and gray lines, a fast RSI (11 periods Relative Strength Index ), and a slow one ( RSI 14 periods as Wilder's half-cycle recommendation).
Note: Regular and hidden divergences will be plotted to help spot interesting spots and help with timing.
- Regular divergences will hint at a slowdown in price action.
- Hidden divergences will hint at a continuation as energy stored as some type of potential energy ready to be released violently. It is also referred ad 'The Slingshot'
Momentum
To understand Momentum, we must know that in physics Momentum = mass * velocity
We will understand mass as the mass of money of the market, which is found in the volume. To represent this concept a colored cloud will be plotted, this area will be given by MFI (13 periods Money Flow Index) and VRSI (Volume RSI ), when MFI is above VRSI will be colored dark blue, else red.
Note: Regular and hidden divergences on MFI will be plotted.
Volatility
The key to making this Alchemic theory work is to understand the "Transmutation" of the volatility which will be plotted by a multicolor line which will be blue in periods of low volatility and Red in periods of high volatility. I like to see these states as 'Ice' and 'Magma', as some periods the volatility just freezes, giving you hints that maybe a big move can be approaching, and at some points is just burning hot. Something I like about this indicator is that is trend agnostic. The line is named BBWP ( Bollinger Bands Width Percentile), as it calculates the width of the Bollinger bands (13 periods) and plot it as a percentile.
Finally, we will study the volatility of the volume, plotted as the red and purple mountains at the bottom of the indicator. This will complement and confirm the information provided by the Velocity-Momentum concepts.
Final Note
This indicator will only help identify interesting moments in the market, it's very powerful if used correctly, but it might be difficult to read in the beginning. It won't give "signals", as it is for understanding different dimensions in the market, I use it as it fits perfectly my trading strategies and tactics.
Best!
Musashi Alchemist
Script protegido
Este script se publica como código cerrado. No obstante, puede utilizarlo libremente y sin ninguna limitación. Obtenga más información aquí.
Musashi-Alchemist
Exención de responsabilidad
La información y las publicaciones no constituyen, ni deben considerarse como asesoramiento o recomendaciones financieras, de inversión, de trading o de otro tipo proporcionadas o respaldadas por TradingView. Más información en Condiciones de uso.