OPEN-SOURCE SCRIPT
Actualizado Spread Trading Z-Score
Indicator: Z-Score Spread Indicator
Description
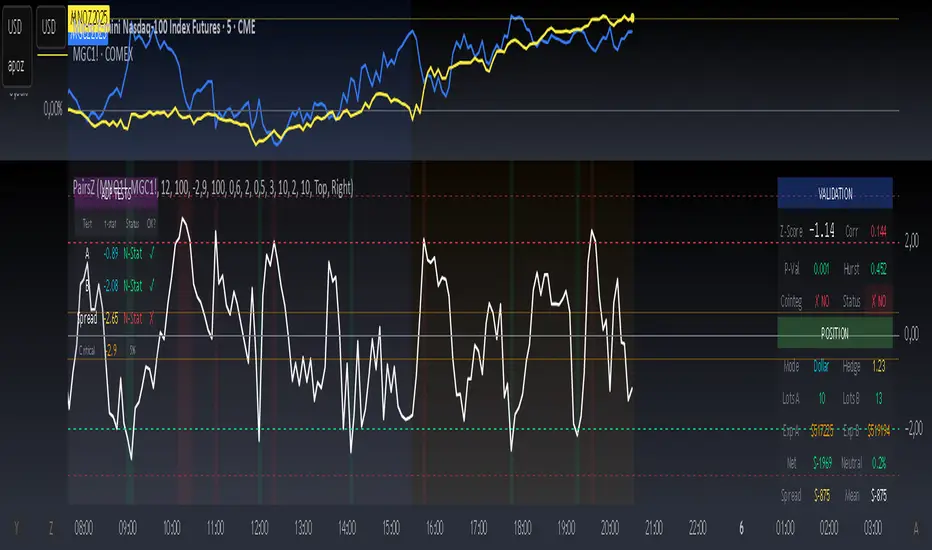
The "Z-Score Spread Indicator" is a powerful tool for traders employing mean-reversion strategies on the spread between two financial assets (e.g., futures contracts like MNQ and MES). This indicator calculates and plots the Z-score of the price spread, indicating how far the current spread deviates from its historical mean. It features customizable entry and exit thresholds with adjustable offsets, along with an estimated p-value displayed in a table to assess statistical significance.
Key Features
Asset Selection: Allows users to select two asset symbols (e.g., CME_MINI:MNQ1! and CME_MINI:MES1!) via customizable inputs.
Z-Score Calculation: Computes the Z-score based on the spread’s simple moving average and standard deviation over a user-defined lookback period.
Customizable Thresholds with Offset: Offers adjustable base entry and exit thresholds, with an optional offset to fine-tune trading levels, plotted as horizontal lines.
P-Value Estimation: Provides an approximate p-value to evaluate the statistical significance of the Z-score, displayed in a table anchored to the top-left corner.
Visual Representation: Plots the Z-score with a zero line and threshold lines for intuitive interpretation.
Adjustable Parameters
Asset A Symbol: Symbol for Asset A (default: CME_MINI:MNQ1!).
Asset B Symbol: Symbol for Asset B (default: CME_MINI:MES1!).
Z-Score Lookback: Lookback period for Z-score calculation (default: 40, minimum 2).
Base Entry Threshold: Threshold for entry signals (default: 1.8, adjustable with a step of 0.1).
Base Exit Threshold: Threshold for exit signals (default: 0.5, adjustable with a step of 0.1).
Threshold Offset (+/-): Offset to adjust entry and exit thresholds symmetrically (default: 0.0, range -5.0 to 5.0, step 0.1).
Usage
Add the indicator to your chart via the "Indicators" tab.
Customize the parameters based on your preferred assets and trading strategy (lookback period, thresholds, offset).
Observe the Z-score plot and threshold lines (red for short entry, green for long entry, orange dotted for exits) to identify potential trade setups.
Check the p-value table in the top-left corner to assess the statistical significance of the current Z-score.
Use this data to inform mean-reversion trading decisions, ideally in conjunction with other indicators.
Notes
A Z-score above the entry threshold (positive) or below the negative entry threshold suggests a potential short or long entry, respectively. Exits are signaled when the Z-score crosses the exit thresholds.
The p-value is an approximation based on the normal distribution; a value below 0.05 typically indicates statistical significance, but further validation is recommended.
The indicator uses a simple spread (Asset A - Asset B) without volatility adjustments; consider pairing it with a lots calculator for hedging.
Limitations
The p-value is an approximation and may not reflect advanced statistical tests (e.g., ADF) due to Pine Script constraints.
No automatic trading signals are generated; it provides data for manual analysis.
Author
Developed by grogusama, October 15, 2025, 07:29 PM CEST.
Description
The "Z-Score Spread Indicator" is a powerful tool for traders employing mean-reversion strategies on the spread between two financial assets (e.g., futures contracts like MNQ and MES). This indicator calculates and plots the Z-score of the price spread, indicating how far the current spread deviates from its historical mean. It features customizable entry and exit thresholds with adjustable offsets, along with an estimated p-value displayed in a table to assess statistical significance.
Key Features
Asset Selection: Allows users to select two asset symbols (e.g., CME_MINI:MNQ1! and CME_MINI:MES1!) via customizable inputs.
Z-Score Calculation: Computes the Z-score based on the spread’s simple moving average and standard deviation over a user-defined lookback period.
Customizable Thresholds with Offset: Offers adjustable base entry and exit thresholds, with an optional offset to fine-tune trading levels, plotted as horizontal lines.
P-Value Estimation: Provides an approximate p-value to evaluate the statistical significance of the Z-score, displayed in a table anchored to the top-left corner.
Visual Representation: Plots the Z-score with a zero line and threshold lines for intuitive interpretation.
Adjustable Parameters
Asset A Symbol: Symbol for Asset A (default: CME_MINI:MNQ1!).
Asset B Symbol: Symbol for Asset B (default: CME_MINI:MES1!).
Z-Score Lookback: Lookback period for Z-score calculation (default: 40, minimum 2).
Base Entry Threshold: Threshold for entry signals (default: 1.8, adjustable with a step of 0.1).
Base Exit Threshold: Threshold for exit signals (default: 0.5, adjustable with a step of 0.1).
Threshold Offset (+/-): Offset to adjust entry and exit thresholds symmetrically (default: 0.0, range -5.0 to 5.0, step 0.1).
Usage
Add the indicator to your chart via the "Indicators" tab.
Customize the parameters based on your preferred assets and trading strategy (lookback period, thresholds, offset).
Observe the Z-score plot and threshold lines (red for short entry, green for long entry, orange dotted for exits) to identify potential trade setups.
Check the p-value table in the top-left corner to assess the statistical significance of the current Z-score.
Use this data to inform mean-reversion trading decisions, ideally in conjunction with other indicators.
Notes
A Z-score above the entry threshold (positive) or below the negative entry threshold suggests a potential short or long entry, respectively. Exits are signaled when the Z-score crosses the exit thresholds.
The p-value is an approximation based on the normal distribution; a value below 0.05 typically indicates statistical significance, but further validation is recommended.
The indicator uses a simple spread (Asset A - Asset B) without volatility adjustments; consider pairing it with a lots calculator for hedging.
Limitations
The p-value is an approximation and may not reflect advanced statistical tests (e.g., ADF) due to Pine Script constraints.
No automatic trading signals are generated; it provides data for manual analysis.
Author
Developed by grogusama, October 15, 2025, 07:29 PM CEST.
Notas de prensa
Update of spread calculation Notas de prensa
Update of spread calculation Notas de prensa
Update beta calculationNotas de prensa
Update : Hurst exposent addedNotas de prensa
Update of the calculation methodNotas de prensa
Reduction of the table sizeNotas de prensa
Update of information for a trade validationNotas de prensa
update of the calculation methodNotas de prensa
Update of the calculation methodNotas de prensa
Update of the visuals and the final calculation method Notas de prensa
Garch implementationNotas de prensa
Lot size adjustedNotas de prensa
Update calculation method Notas de prensa
Added a kalman filter Notas de prensa
Update of the calculation and visuals Notas de prensa
Update of the calculation method Script de código abierto
Fiel al espíritu de TradingView, el creador de este script lo ha convertido en código abierto, para que los traders puedan revisar y verificar su funcionalidad. ¡Enhorabuena al autor! Aunque puede utilizarlo de forma gratuita, recuerde que la republicación del código está sujeta a nuestras Normas internas.
Exención de responsabilidad
La información y las publicaciones no constituyen, ni deben considerarse como asesoramiento o recomendaciones financieras, de inversión, de trading o de otro tipo proporcionadas o respaldadas por TradingView. Más información en Condiciones de uso.
Script de código abierto
Fiel al espíritu de TradingView, el creador de este script lo ha convertido en código abierto, para que los traders puedan revisar y verificar su funcionalidad. ¡Enhorabuena al autor! Aunque puede utilizarlo de forma gratuita, recuerde que la republicación del código está sujeta a nuestras Normas internas.
Exención de responsabilidad
La información y las publicaciones no constituyen, ni deben considerarse como asesoramiento o recomendaciones financieras, de inversión, de trading o de otro tipo proporcionadas o respaldadas por TradingView. Más información en Condiciones de uso.