OPEN-SOURCE SCRIPT
D/W/M RSI & %CHNG + ATR
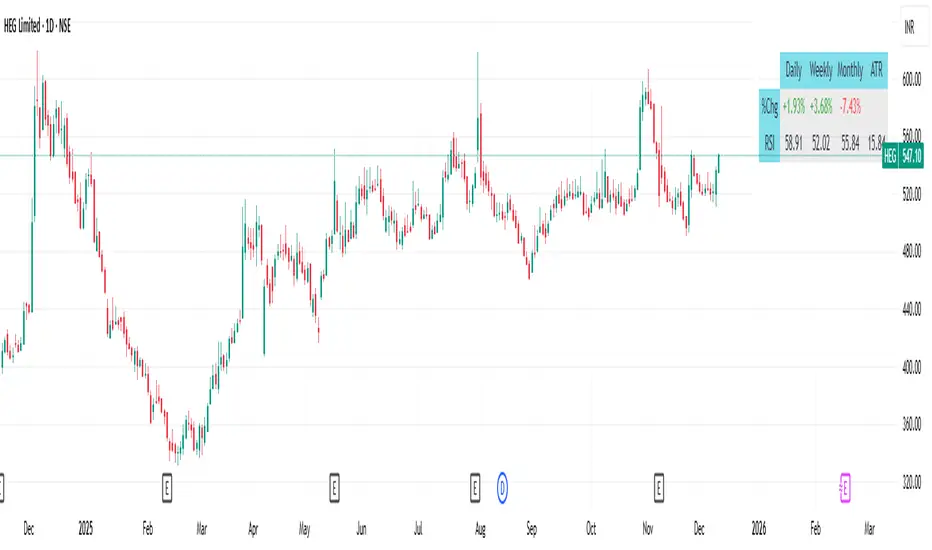
This indicator provides a comprehensive, at-a-glance dashboard displaying key technical metrics across multiple timeframes: Daily, Weekly, and Monthly. It tracks Price Change Percentage, Relative Strength Index (RSI), and Average True Range (ATR) for each timeframe, helping traders quickly assess market trends, momentum, and volatility in one view.
Key Features:
Price Change % (Daily/Weekly/Monthly):
Displays the percentage change in price over the selected timeframes, giving traders insight into short-term, medium-term, and long-term price movement trends.
Relative Strength Index (RSI):
Shows the RSI value on Daily, Weekly, and Monthly timeframes. The RSI measures momentum, indicating overbought or oversold conditions:
Average True Range (ATR):
Tracks the ATR across multiple timeframes to assess market volatility. Higher ATR values signify more significant price movement (higher volatility), while lower values suggest quieter markets.
This indicator helps traders make informed decisions by quickly visualizing price momentum, market volatility, and possible trend reversals. It's ideal for swing traders, day traders, and long-term investors who need a bird's-eye view of the market across different timeframes.
How to Use:
Add the indicator to your TradingView chart.
Review the Price Change % to see how the market is trending across the selected timeframes.
Use the RSI to identify overbought or oversold conditions.
Check the ATR to assess current market volatility and adjust position sizes accordingly.
Script de código abierto
Fiel al espíritu de TradingView, el creador de este script lo ha convertido en código abierto, para que los traders puedan revisar y verificar su funcionalidad. ¡Enhorabuena al autor! Aunque puede utilizarlo de forma gratuita, recuerde que la republicación del código está sujeta a nuestras Normas internas.
Exención de responsabilidad
La información y las publicaciones no constituyen, ni deben considerarse como asesoramiento o recomendaciones financieras, de inversión, de trading o de otro tipo proporcionadas o respaldadas por TradingView. Más información en Condiciones de uso.