OPEN-SOURCE SCRIPT
Tick Time/Speed
The Tick Time/Speed indicator highlights the latest TradingView feature, Tick Charts (beta), and aims to provide a visual representation of the speed.
🔶 USAGE

1-minute chart
Unlike regular charts, where the time difference between two bars is relatively equal, the time difference between two tick bars can vary.

1T chart


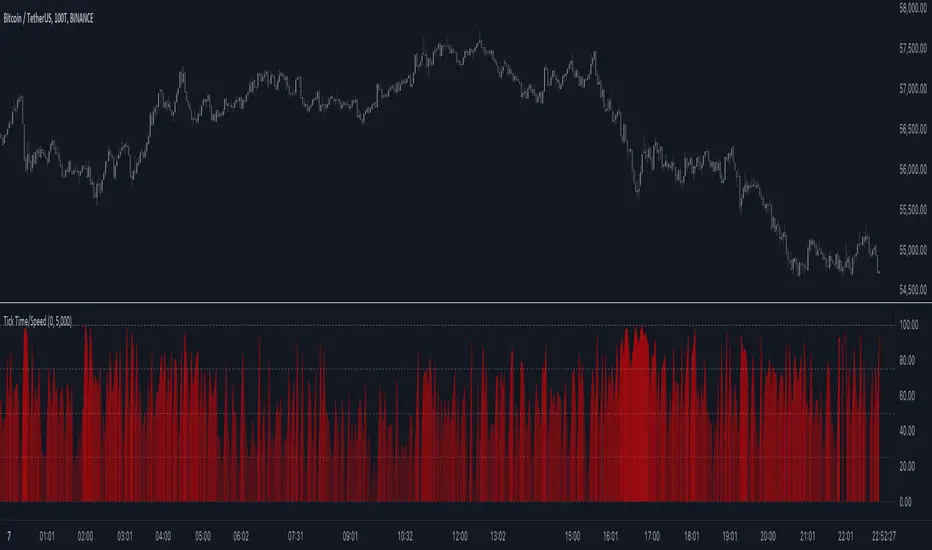
10T chart (ticks groups per 10)

100T chart (ticks groups per 100)
(zoom in to see the time scale, as can be seen in the above two examples, higher values represent more ticks in a shorter period of time)
The difference in time (speed) against previous tick(s) is added to an array and sorted. The measured speed is compared against every value in the array and then plotted.
A smaller difference in time against other ticks (more ticks in less time) is plotted higher, while a more prominent time difference is plotted at a lower level.
The amount of data (to compare with) can be set by "Calculated Bars".

The above example uses data from the last 5000, 100, and 77 bars.
🔶 SETTINGS
• Color & transparency setting
• Calculated Bars: sets the size of the array; in other words, sets the amount of available data for 'speed' comparison
🔶 NOTES
🔶 USAGE
1-minute chart
Unlike regular charts, where the time difference between two bars is relatively equal, the time difference between two tick bars can vary.
1T chart
10T chart (ticks groups per 10)
100T chart (ticks groups per 100)
(zoom in to see the time scale, as can be seen in the above two examples, higher values represent more ticks in a shorter period of time)
The difference in time (speed) against previous tick(s) is added to an array and sorted. The measured speed is compared against every value in the array and then plotted.
A smaller difference in time against other ticks (more ticks in less time) is plotted higher, while a more prominent time difference is plotted at a lower level.
The amount of data (to compare with) can be set by "Calculated Bars".
The above example uses data from the last 5000, 100, and 77 bars.
🔶 SETTINGS
• Color & transparency setting
• Calculated Bars: sets the size of the array; in other words, sets the amount of available data for 'speed' comparison
🔶 NOTES
- At this point of time, Tick Charts are only reserved for Professional-tier plans – Expert, Elite, or Ultimate plan.
- The indicator can only be used with Tick Data.
- Not all exchanges have tick data at the moment, this means not every ticker will have Tick Data.
Script de código abierto
Fiel al espíritu de TradingView, el creador de este script lo ha convertido en código abierto, para que los traders puedan revisar y verificar su funcionalidad. ¡Enhorabuena al autor! Aunque puede utilizarlo de forma gratuita, recuerde que la republicación del código está sujeta a nuestras Normas internas.
Who are PineCoders?
tradingview.com/chart/SSP/yW5eOqtm-Who-are-PineCoders/
TG Pine Script® Q&A: t.me/PineCodersQA
- We cannot control our emotions,
but we can control our keyboard -
tradingview.com/chart/SSP/yW5eOqtm-Who-are-PineCoders/
TG Pine Script® Q&A: t.me/PineCodersQA
- We cannot control our emotions,
but we can control our keyboard -
Exención de responsabilidad
La información y las publicaciones no constituyen, ni deben considerarse como asesoramiento o recomendaciones financieras, de inversión, de trading o de otro tipo proporcionadas o respaldadas por TradingView. Más información en Condiciones de uso.