OPEN-SOURCE SCRIPT
Chervolinos-Wave-PM-Forecast
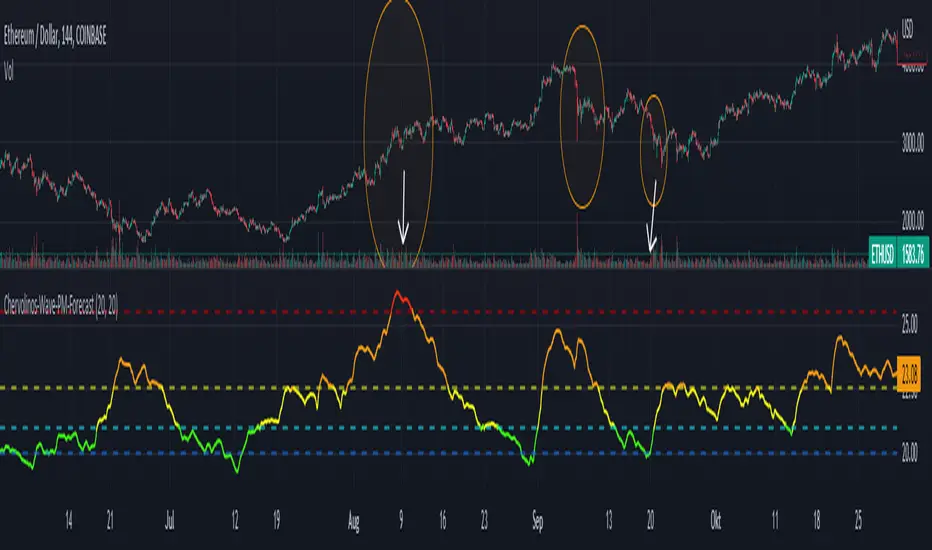
The Wave PM (Whistler Active Volatility Energy – Price Mass) indicator is an oscillator described in Mark Whistler's book, Volatility Illuminated.
The Wave PM is specifically designed to help read volatility cycles. When we visualize volatility cycles as a chart, we can get a clear view of the market volatility phases in multiple time frames. This indicator forms an arithmetic mean over 30 observed periods. Traders can thus get a better insight into "potential" volatility from up to pent-up energy, the different zones give strong help to predict future price developments.
Possible interpretation patterns:
You are at the end of a long uptrend and you want to know if the price is going to go down, if the indicator shows red and the value is above 25, it is likely to do so.
You're in a downtrend and there's a bit of a recovery phase, so you might be wondering if it's going to continue when the indicator shows green. It would go further with yellow, but with green it can be assumed that it is going down rapidly.
Special thanks to sourcey who programmed the 3D Wave-PM.
This variant of sourcey looks very nice, but was too confusing for me. In order to get a strong overview, forming an arithmetic mean is very useful.
I hope you and the Mods like my version
Best regards, Chervolino
Script de código abierto
Fiel al espíritu de TradingView, el creador de este script lo ha convertido en código abierto, para que los traders puedan revisar y verificar su funcionalidad. ¡Enhorabuena al autor! Aunque puede utilizarlo de forma gratuita, recuerde que la republicación del código está sujeta a nuestras Normas internas.
Exención de responsabilidad
La información y las publicaciones no constituyen, ni deben considerarse como asesoramiento o recomendaciones financieras, de inversión, de trading o de otro tipo proporcionadas o respaldadas por TradingView. Más información en Condiciones de uso.