OPEN-SOURCE SCRIPT
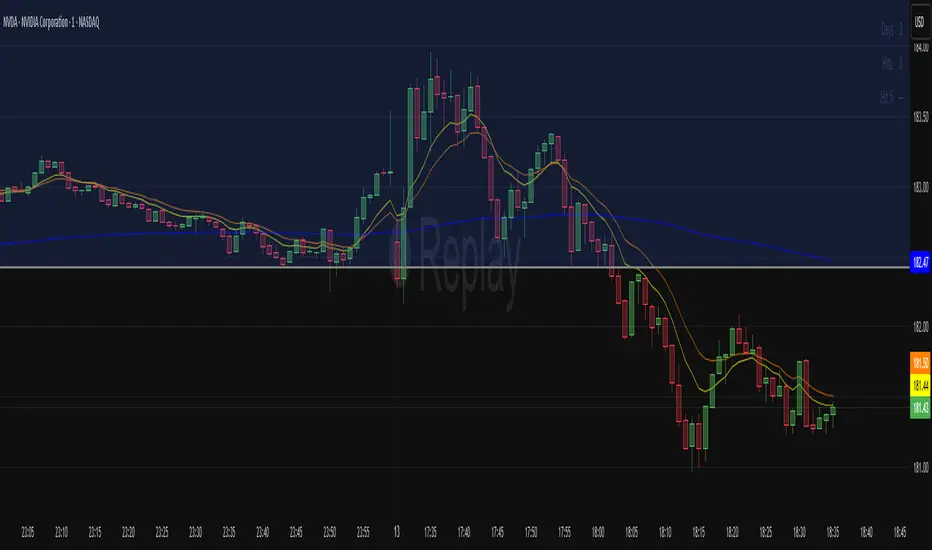
Prev-Day POC Hit Rate (v6, RTH, tolerance)

//version=6
indicator("Prev-Day POC Hit Rate (v6, RTH, tolerance)", overlay=true)
// ---- Inputs
sessionStr = input.session("0930-1600", "RTH session (exchange time)")
tolPoints = input.float(0.10, "Tolerance (points)")
tolPercent = input.float(0.10, "Tolerance (%) of prev POC")
showMarks = input.bool(true, "Show touch markers")
// ---- RTH gating in exchange TZ
sessFlag = time(timeframe.period, sessionStr)
inRTH = not na(sessFlag)
rthOpen = inRTH and not inRTH[1]
rthClose = (not inRTH) and inRTH[1]
// ---- Prior-day POC proxy = price of highest-volume 1m bar of prior RTH
var float prevPOC = na
var float curPOC = na
var float curMaxVol = 0.0
// ---- Daily hit stats
var bool hitToday = false
var int days = 0
var int hits = 0
// Finalize a day at RTH close (count touch to prevPOC)
if rthClose and not na(prevPOC)
days += 1
if hitToday
hits += 1
// Roll today's POC to prevPOC at next RTH open; reset builders/flags
if rthOpen
prevPOC := curPOC
curPOC := na
curMaxVol := 0.0
hitToday := false
// Build today's proxy POC during RTH (highest-volume 1m bar)
if inRTH
if volume > curMaxVol
curMaxVol := volume
curPOC := close // swap to (high+low+close)/3 if you prefer HLC3
// ---- Touch test against prevPOC (band = max(points, % of prevPOC))
bandPts = na(prevPOC) ? na : math.max(tolPoints, prevPOC * tolPercent * 0.01)
touched = inRTH and not na(prevPOC) and high >= (prevPOC - bandPts) and low <= (prevPOC + bandPts)
if touched
hitToday := true
// ---- Plots
plot(prevPOC, "Prev RTH POC (proxy)", color=color.new(color.fuchsia, 0), linewidth=2, style=plot.style_linebr)
bgcolor(hitToday and inRTH ? color.new(color.green, 92) : na)
plotshape(showMarks and touched ? prevPOC : na, title="Touch prev POC",
style=shape.circle, location=location.absolute, size=size.tiny, color=color.new(color.aqua, 0))
// ---- On-chart stats
hitPct = days > 0 ? (hits * 100.0 / days) : na
var table T = table.new(position.top_right, 2, 3, border_width=1)
if barstate.islastconfirmedhistory
table.cell(T, 0, 0, "Days")
table.cell(T, 1, 0, str.tostring(days))
table.cell(T, 0, 1, "Hits")
table.cell(T, 1, 1, str.tostring(hits))
table.cell(T, 0, 2, "Hit %")
table.cell(T, 1, 2, na(hitPct) ? "—" : str.tostring(hitPct, "#.0") + "%")
Script de código abierto
Siguiendo fielmente el espíritu de TradingView, el creador de este script lo ha publicado en código abierto, permitiendo que otros traders puedan revisar y verificar su funcionalidad. ¡Enhorabuena al autor! Puede utilizarlo de forma gratuita, pero tenga en cuenta que la publicación de este código está sujeta a nuestras Normas internas.
Exención de responsabilidad
La información y las publicaciones que ofrecemos, no implican ni constituyen un asesoramiento financiero, ni de inversión, trading o cualquier otro tipo de consejo o recomendación emitida o respaldada por TradingView. Puede obtener información adicional en las Condiciones de uso.