OPEN-SOURCE SCRIPT
Actualizado Forecasting - Holt’s Linear Trend Forecasting
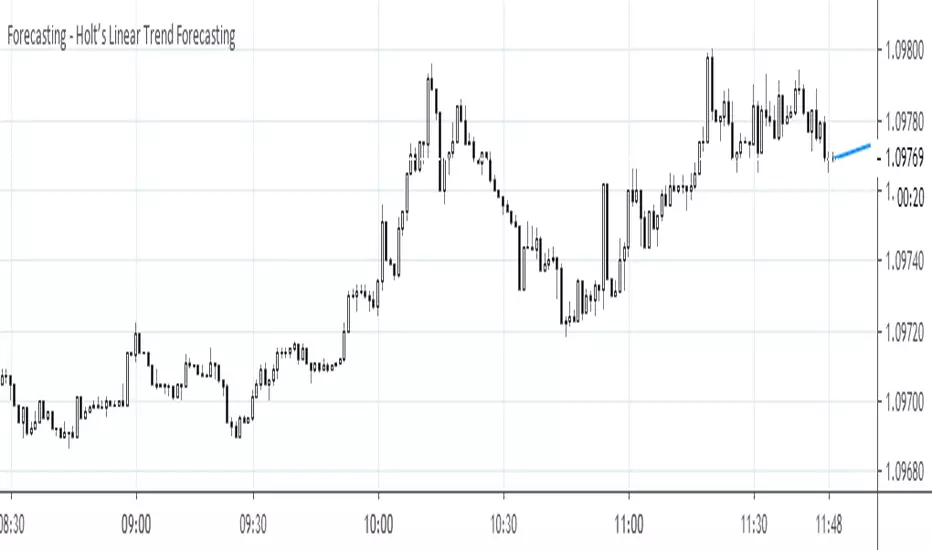
Holt's Forecasting method
Holt (1957) extended simple exponential smoothing to allow the forecasting of data with a trend. This method involves a forecast equation and two smoothing equations (one for the level and one for the trend):
Forecast equation: ŷ = l + h * b
Level equation: l = alpha * y + (1 - alpha) * (l + b)
Trend equation: b = beta * (l - l) + (1 - beta) * b
where:
l (or l) denotes an estimate of the level of the series at time t,
b (or b) denotes an estimate of the trend (slope) of the series at time t,
alpha is the smoothing parameter for the level, 0 ≤ alpha ≤ 1, and
beta is the smoothing parameter for the trend, 0 ≤ beta ≤ 1.
As with simple exponential smoothing, the level equation here shows that l is a weighted average of observation y and the one-step-ahead training forecast for time t, here given by l+b. The trend equation shows that b is a weighted average of the estimated trend at time t based on l-l and b, the previous estimate of the trend.
The forecast function is not flat but trending. The h-step-ahead forecast is equal to the last estimated level plus h times the last estimated trend value. Hence the forecasts are a linear function of h.
Notas de prensa
Minor fix in documentation.Script de código abierto
Fiel al espíritu de TradingView, el creador de este script lo ha convertido en código abierto, para que los traders puedan revisar y verificar su funcionalidad. ¡Enhorabuena al autor! Aunque puede utilizarlo de forma gratuita, recuerde que la republicación del código está sujeta a nuestras Normas internas.
Exención de responsabilidad
La información y las publicaciones no constituyen, ni deben considerarse como asesoramiento o recomendaciones financieras, de inversión, de trading o de otro tipo proporcionadas o respaldadas por TradingView. Más información en Condiciones de uso.
Script de código abierto
Fiel al espíritu de TradingView, el creador de este script lo ha convertido en código abierto, para que los traders puedan revisar y verificar su funcionalidad. ¡Enhorabuena al autor! Aunque puede utilizarlo de forma gratuita, recuerde que la republicación del código está sujeta a nuestras Normas internas.
Exención de responsabilidad
La información y las publicaciones no constituyen, ni deben considerarse como asesoramiento o recomendaciones financieras, de inversión, de trading o de otro tipo proporcionadas o respaldadas por TradingView. Más información en Condiciones de uso.