PROTECTED SOURCE SCRIPT
Actualizado Epic Market Indicator 2.0 (EMI 2)
After months and months of back-testing, I have finally decided to release this update. Would also like to give out a special thanks to Tradingview for making it possible to create scripts and share this with the community. I have occurred a lot of information in this community. I believe that when you take, you should also share. That’s why I am sharing this wonderful indicator for free. Remember, knowledge and experience is the most valuable things in life.
EMI, Epic Market Indicator:
60-74% theoretically profitable trades, depending on the time period. However if you use EMI blindly, the percentage might even go lower. Nevertheless, there should be enough presenting opportunities, if you use her wisely.
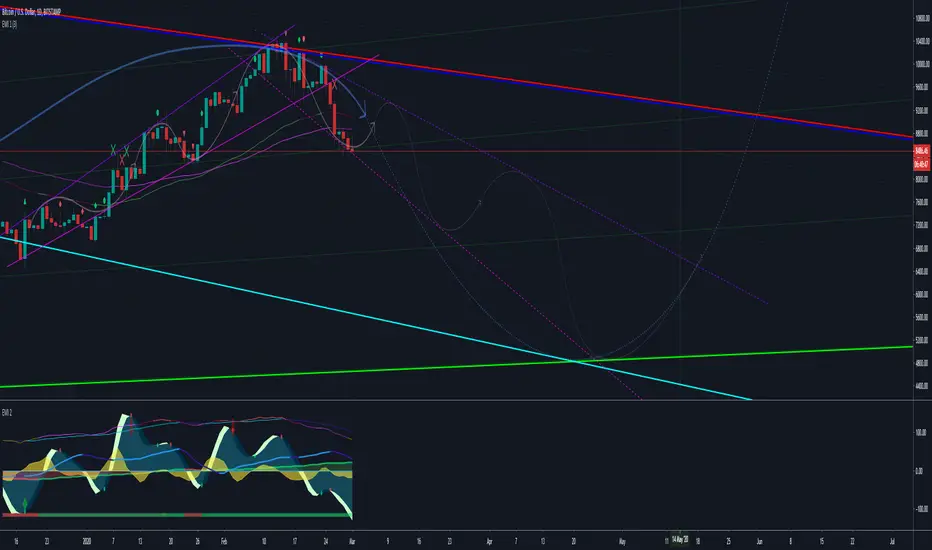
This indicator is a combination of different oscillators:
Common:
-MACD
-VWAP
-RSI
-Stochastic
-Volume Flow
-Buy & Sell signals
-Bottom & Top signals
-Volume Flow heat map
RSI turns green or red when entering overbought or oversold territories.
Dots on wave crossings are buy or sell signals.
Diamonds above are possible bottoms and tops.
Green = Bull signals
Red = Sell signals
These signals are buy & sell conditions based on different oscillators, known by many traders.
ALWAYS wait for the candle to close and another confirmation before taking any consideration nor actions. No signals means trend continuation.
Using EMI 2 in combination with EMI 1, traditional authentic pattern formations and darkened theme is recommended. Good luck fellow traders and don't forget to tap the like button. Thanks in advance.
EMI, Epic Market Indicator:
60-74% theoretically profitable trades, depending on the time period. However if you use EMI blindly, the percentage might even go lower. Nevertheless, there should be enough presenting opportunities, if you use her wisely.
This indicator is a combination of different oscillators:
Common:
-MACD
-VWAP
-RSI
-Stochastic
-Volume Flow
-Buy & Sell signals
-Bottom & Top signals
-Volume Flow heat map
RSI turns green or red when entering overbought or oversold territories.
Dots on wave crossings are buy or sell signals.
Diamonds above are possible bottoms and tops.
Green = Bull signals
Red = Sell signals
These signals are buy & sell conditions based on different oscillators, known by many traders.
ALWAYS wait for the candle to close and another confirmation before taking any consideration nor actions. No signals means trend continuation.
Using EMI 2 in combination with EMI 1, traditional authentic pattern formations and darkened theme is recommended. Good luck fellow traders and don't forget to tap the like button. Thanks in advance.
Notas de prensa
Update EMI 2, Description:- Modified RSI and Stochastic settings and conditions
- Corrected RSI colors when in overbought or oversold territory
- Modified Money/Volume Flow settings
Notas de prensa
-Modified RSI & Stochastic-Modified Wave Trend settings for smoother looks and even more accurate predicting possible tops & bottoms
-Adjusted overbought and oversold territories
Notas de prensa
Minor adjustments:-Color of RSI changes into more lightened colors when entering deeper level of overbought or oversold territories.
-Small settings adjustments concerning money flow
Script protegido
Este script se publica como código cerrado. No obstante, puede utilizarlo libremente y sin ninguna limitación. Obtenga más información aquí.
Exención de responsabilidad
La información y las publicaciones no constituyen, ni deben considerarse como asesoramiento o recomendaciones financieras, de inversión, de trading o de otro tipo proporcionadas o respaldadas por TradingView. Más información en Condiciones de uso.