OPEN-SOURCE SCRIPT
Actualizado MACD MTF Lines
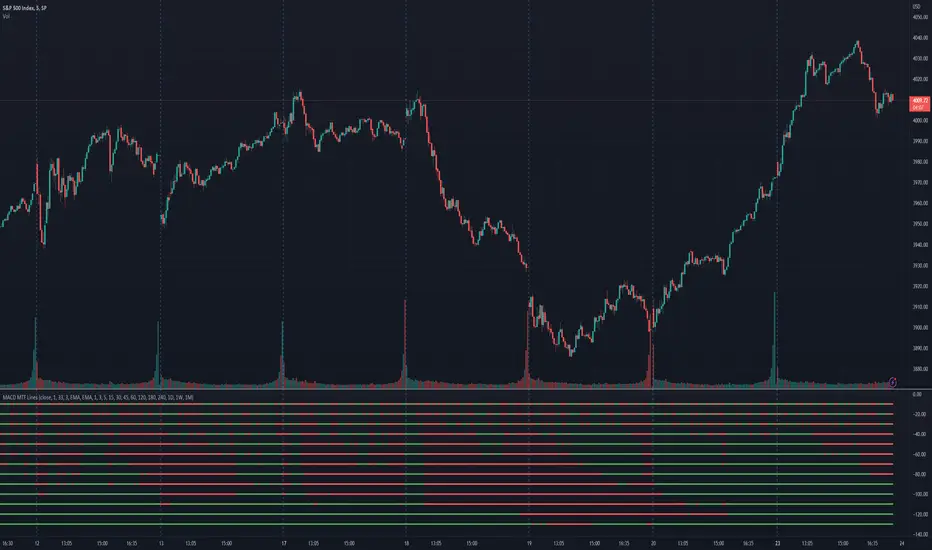
The indicator shows the MACD histogram sign (positive or negative) for several timeframes at once. You can see at a glance how the price is trending across higher and lower timeframes.
The code uses recursive calculations for the SMA and EMA to avoid lookahead errors and repainting on higher timeframes.
Note that, for lower timeframes, the line becomes yellow to the left because history is limited and there are not enough bars to calculate.
The code uses recursive calculations for the SMA and EMA to avoid lookahead errors and repainting on higher timeframes.
Note that, for lower timeframes, the line becomes yellow to the left because history is limited and there are not enough bars to calculate.
Notas de prensa
The indicator was updated to show the maximum number of lines supported.Notas de prensa
Each line can be enabled or disabled individually, so that unused ones can be hidden.Notas de prensa
Added simple trend detection based on the number of bullish and bearish timeframes; threshold can be changed in Settings.Added data outputs:
* "Score": counting the net number of bullish and bearish timeframes
* "Trend": changes to bullish or bearish as the score goes over or under the threshold
Added background color (green or red according to trend); can be enabled in Settings.
Added alert for trend change.
Fix: named individual timeframe outputs.
Notas de prensa
Added another alert with a separate threshold score for flexibility.Notas de prensa
Fix: minimum values set to 1.Notas de prensa
Added score weights for further customization of trend detection and alerts. Input parameters are now set in terms of score values instead of number of lines.Notas de prensa
Release notes:Added input options to choose alert modes for trend and extra alerts. The options are:
* once per bar close (default)
* once per bar
* every time
Script de código abierto
Fiel al espíritu de TradingView, el creador de este script lo ha convertido en código abierto, para que los traders puedan revisar y verificar su funcionalidad. ¡Enhorabuena al autor! Aunque puede utilizarlo de forma gratuita, recuerde que la republicación del código está sujeta a nuestras Normas internas.
Exención de responsabilidad
La información y las publicaciones no constituyen, ni deben considerarse como asesoramiento o recomendaciones financieras, de inversión, de trading o de otro tipo proporcionadas o respaldadas por TradingView. Más información en Condiciones de uso.