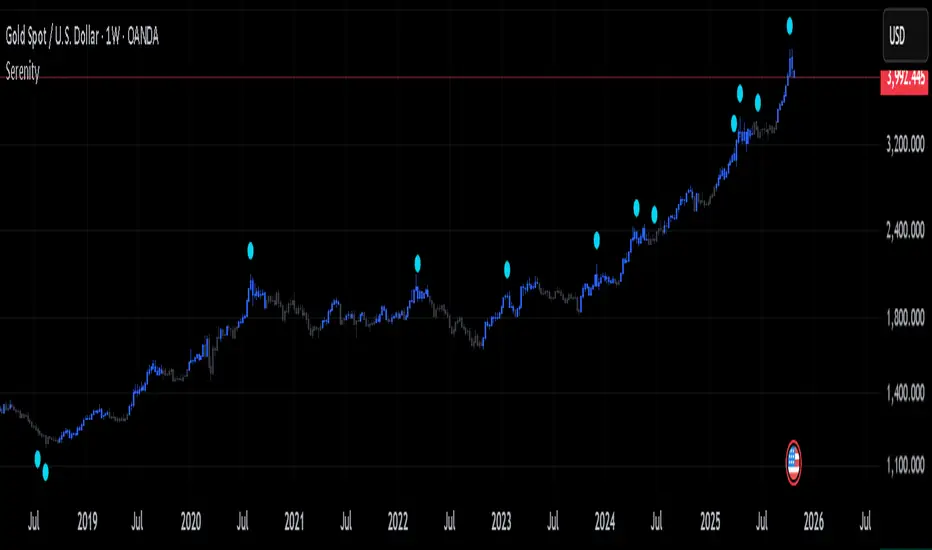
Serenity

Every trader starts somewhere, often diving headfirst into the markets with charts cluttered by layers of lines, oscillators, and signals. It's easy to get caught up testing one approach after another—adding more tools, tweaking strategies, chasing the latest idea that promises clarity. The cycle repeats: overload the setup, second-guess every move, switch things up when results don't click right away. Over time, it becomes clear that jumping between setups rarely builds the consistency needed to navigate the ups and downs.
That's where the idea for Serenity came from—a way to step back from the noise and focus on a structured approach that encourages sticking to a plan and building consistency.
Built on the philosophy that no single perspective captures the full picture, Serenity offers two complementary views—Skye and Shade—to provide a more rounded interpretation of the market. Serenity’s logic builds on core market concepts—trend, momentum, and volume—combining them through carefully structured conditions that work across multiple timeframes. By focusing on where these elements align, it highlights key moments in the market while filtering out noise, providing clear and meaningful visual cues for analysis.
How Serenity Works
Serenity is designed to cut through market noise and simplify complex price action. By combining public, simple, everyday indicators and concepts into a progressive decision hierarchy of multi-layered signals, it removes ambiguity and leaves no room for guesswork—providing traders with straightforward, easy-to-read visual cues for decision-making.
Serenity's foundation starts with a core trend bias, built around two key concepts that set the stage for all signals:
Volatility-adjusted trend boundary (ATR-based) defines real-time directional bias using a dynamic channel that expands in choppy markets and tightens in calm ones — it only shifts when price proves real strength or weakness. This provides the overall market context, ensuring signals are in harmony with the prevailing direction.
Four nested volume-weighted price zones create progressive support levels—each acting as a filter for signal quality. These zones build on the trend boundary, requiring price to prove itself at increasing levels of conviction before triggering visuals.
Skye: Agile Momentum
Skye focuses on the faster side of market behavior. It reacts quickly to changes in trend and momentum, making it well-suited for traders who prefer agility and earlier entries. Skye thrives in environments where price moves sharply and timing matters.
Skye activates only when five independent filters align:
Momentum reversal — fast oscillator crosses above slow.
Volume surge — confirms participation strength, signaling that fresh momentum is backed by meaningful activity rather than isolated price movement.
Zone break — price closes above the earliest volume-weighted level.
Trend support — price remains above the dynamic channel.
Directional strength — positive momentum index rises above a required minimum.
This multi-condition gate eliminates single-trigger noise.
Shade: Structural Conviction Filter
Shade takes a more conservative stance, emphasizing broader confirmations and requires sustained dominance across four core pillars:
Long-term structure — price holds above deep volume-weighted trend.
Directional control — one side clearly dominates.
Zone hold — price sustains in mid or deep confluence level.
Volume trend — reveals sustained directional flow, confirming underlying market commitment behind the trend.
Each pillar must confirm — no partial signals.
Twilight & Eclipse: Reversal Cues
Twilight Reversal
Twilight draws attention to areas where upward momentum might begin to build. It serves as a visual cue for zones where buying interest could be forming, helping you focus on potential opportunities for a positive shift in market behavior.
Eclipse Reversal
Eclipse highlights areas where downward pressure may be emerging. It marks zones where sellers could be gaining influence, guiding your attention to potential points where market strength may start to wane.
These markers appear using:
Smoothed divergence — oscillator deviates from price at extremes.
Trend peak — strength index rolls over from overbought/oversold.
Volume opposition — surge against price direction.
What Makes Serenity Unique
What sets Serenity apart is not which concepts or indicators are used—but how they are applied together. Serenity employs a progressive decision hierarchy of multi-layered signals to identify meaningful confluences across trend, momentum, volume, and structure.
Instead of using standard setups that rely on default indicator inputs, Serenity uses carefully chosen, non-standard tailored inputs, ensuring that familiar indicators work together in a unique, confluence-driven way—offering structured context and visually intuitive cues to support clearer decision-making.
Script que requiere invitación
Solo los usuarios autorizados por el autor pueden acceder a este script. Deberá solicitar y obtener permiso para utilizarlo. Por lo general, este se concede tras realizar el pago. Para obtener más información, siga las instrucciones del autor indicadas a continuación o póngase en contacto directamente con SerenityLabs.
TradingView NO recomienda pagar por un script ni utilizarlo a menos que confíe plenamente en su autor y comprenda cómo funciona. También puede encontrar alternativas gratuitas y de código abierto en nuestros scripts de la comunidad.
Instrucciones del autor
Exención de responsabilidad
Script que requiere invitación
Solo los usuarios autorizados por el autor pueden acceder a este script. Deberá solicitar y obtener permiso para utilizarlo. Por lo general, este se concede tras realizar el pago. Para obtener más información, siga las instrucciones del autor indicadas a continuación o póngase en contacto directamente con SerenityLabs.
TradingView NO recomienda pagar por un script ni utilizarlo a menos que confíe plenamente en su autor y comprenda cómo funciona. También puede encontrar alternativas gratuitas y de código abierto en nuestros scripts de la comunidad.