OPEN-SOURCE SCRIPT
NQ YM Correlation 1 min data
Overview
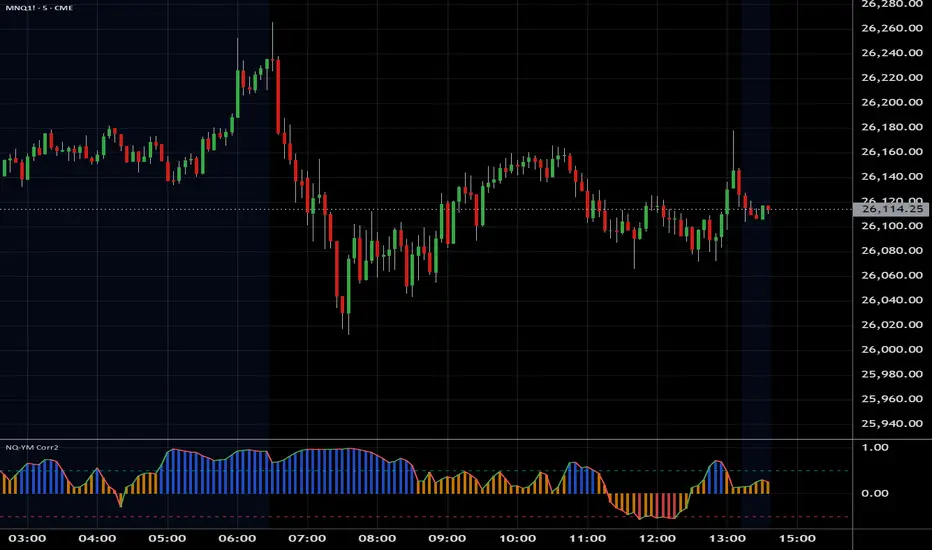
This indicator plots the correlation between Nasdaq 100 (NQ) and Dow Jones (YM) futures. It is specifically designed to act as an "Engine RPM" gauge for pairs traders who trade divergence or spread breakouts—not mean reversion.
To ensure consistent readings, this indicator always calculates using a 1-minute timeframe data, regardless of the chart timeframe you are currently viewing.
The core idea is:
High Correlation (Blue Zone): "Low RPM" or "Engine Idle." NQ and YM are moving together. The spread is flat. This is a no-trade zone.
Low Correlation (Red Zone): "High RPM" or "Engine Hot." NQ and YM are diverging. The spread is moving. This is the primary trade zone.
Script de código abierto
Fiel al espíritu de TradingView, el creador de este script lo ha convertido en código abierto, para que los traders puedan revisar y verificar su funcionalidad. ¡Enhorabuena al autor! Aunque puede utilizarlo de forma gratuita, recuerde que la republicación del código está sujeta a nuestras Normas internas.
Exención de responsabilidad
La información y las publicaciones no constituyen, ni deben considerarse como asesoramiento o recomendaciones financieras, de inversión, de trading o de otro tipo proporcionadas o respaldadas por TradingView. Más información en Condiciones de uso.