OPEN-SOURCE SCRIPT
Previous High/Low Range (D,W,M,Q)
Previous High/Low Range (D, W, M, Q)
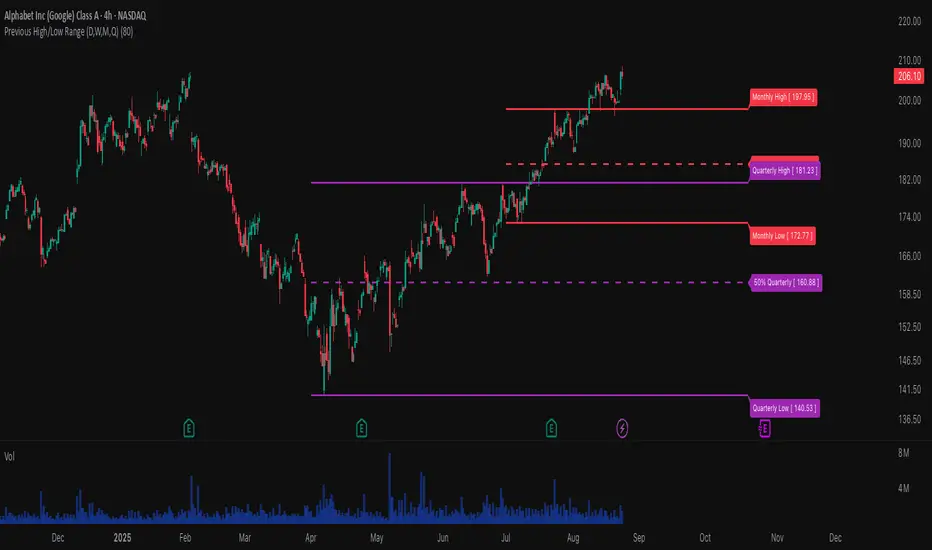
This indicator displays the previous period’s high, low, and midpoint levels across multiple timeframes: Daily, Weekly, Monthly, and Quarterly. It extends these key price levels into the future, allowing traders to quickly identify important support and resistance zones based on historical price action.
Features:
Shows previous Daily, Weekly, Monthly, and Quarterly highs, lows, and midpoints.
Optionally extends these levels forward for easy visualization.
Configurable colors and visibility for each timeframe.
Includes optional midpoint lines at 50% between high and low to identify equilibrium points.
Supports logarithmic scale calculations for midpoints to maintain accuracy on log charts.
Optional labels that display exact price values for each level.
Designed to help traders recognize key levels for entries, exits, and risk management.
Use this indicator to gain a multi-timeframe perspective on significant price ranges and anticipate potential reversal or breakout zones.
Script de código abierto
Siguiendo fielmente el espíritu de TradingView, el creador de este script lo ha publicado en código abierto, permitiendo que otros traders puedan revisar y verificar su funcionalidad. ¡Enhorabuena al autor! Puede utilizarlo de forma gratuita, pero tenga en cuenta que la publicación de este código está sujeta a nuestras Normas internas.
Exención de responsabilidad
La información y las publicaciones que ofrecemos, no implican ni constituyen un asesoramiento financiero, ni de inversión, trading o cualquier otro tipo de consejo o recomendación emitida o respaldada por TradingView. Puede obtener información adicional en las Condiciones de uso.