PROTECTED SOURCE SCRIPT
Actualizado MC RSI + Stoch (multi-level bands)
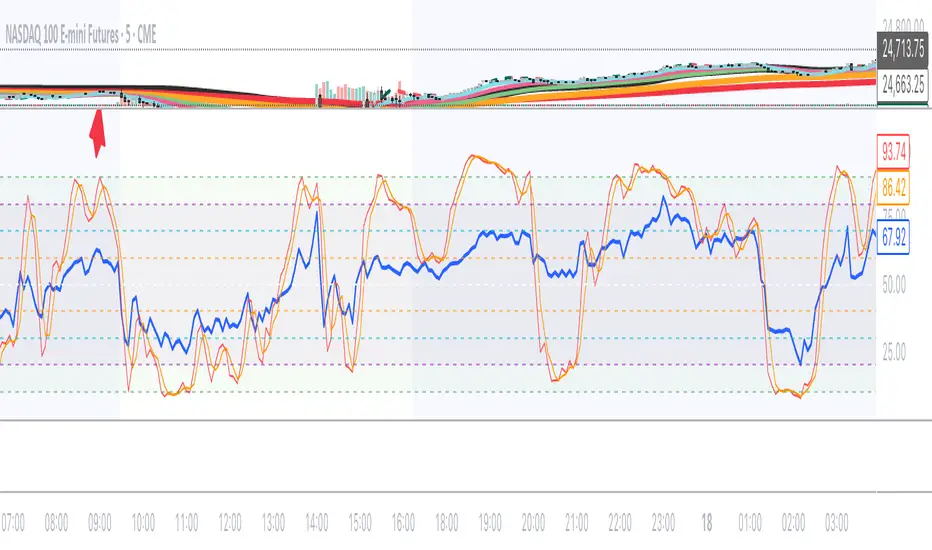
This indicator combines RSI and Stochastic Oscillator into a single panel for easier market analysis. It is designed for traders who want both momentum context and precise timing, with multiple reference levels for better decision-making.
🔧 Features
RSI (Relative Strength Index) with adjustable length (default 14).
Stochastic Oscillator (default 18, 9, 5) with smoothing applied to %K.
Both oscillators plotted in the same scale (0–100) for clear comparison.
Custom horizontal levels:
10 & 90 (purple)
20 & 80 (teal)
30 & 70 (blue)
40 & 60 (gray)
50 midline (red) for balance point reference.
Optional shaded band between 20–80 for quick visualization of momentum extremes.
Toggle switches to show/hide RSI or Stochastic independently.
🎯 How to Use
RSI gives the overall momentum strength.
Stochastic provides faster entry/exit signals by showing short-term momentum shifts.
Use the multi-level bands to identify different market conditions:
10/90 = Extreme exhaustion zones.
20/80 = Overbought/oversold boundaries.
30/70 = Secondary confirmation levels.
40/60 = Neutral momentum bands.
50 = Midline equilibrium.
Notas de prensa
This indicator combines RSI and Stochastic Oscillator into a single panel for easier market analysis. It is designed for traders who want both momentum context and precise timing, with multiple reference levels for better decision-making.🔧 Features
RSI (Relative Strength Index) with adjustable length (default 14).
Stochastic Oscillator (default 18, 9, 5) with smoothing applied to %K.
Both oscillators plotted in the same scale (0–100) for clear comparison.
Custom horizontal levels:
10 & 90 (purple)
20 & 80 (teal)
30 & 70 (blue)
40 & 60 (gray)
50 midline (red) for balance point reference.
Optional shaded band between 20–80 for quick visualization of momentum extremes.
Toggle switches to show/hide RSI or Stochastic independently.
Script protegido
Este script se publica como código cerrado. No obstante, puede utilizarlo libremente y sin ninguna limitación. Obtenga más información aquí.
Exención de responsabilidad
La información y las publicaciones no constituyen, ni deben considerarse como asesoramiento o recomendaciones financieras, de inversión, de trading o de otro tipo proporcionadas o respaldadas por TradingView. Más información en Condiciones de uso.