PROTECTED SOURCE SCRIPT
Valuation Bands (Dynamic + Table)
Valuation Bands (Dynamic + Table)
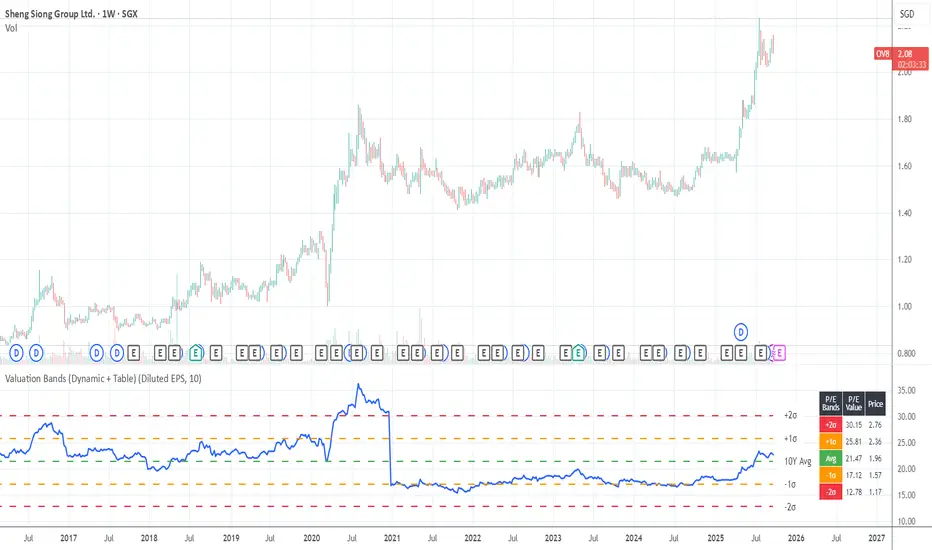
This indicator helps investors assess whether a stock is trading at cheap, fair, or expensive levels relative to its historical valuation multiples. It dynamically calculates valuation ratios such as P/E, P/B, P/S, P/Operating Income, P/Cash Flow, or Dividend Yield over a customizable lookback period (e.g., 10 years).
Using these ratios, the script plots the long-term average alongside ±1σ and ±2σ standard deviation bands, highlighting valuation zones. The included data table displays both the multiple values and their corresponding price levels, making it easy to interpret fair value ranges.
Alerts are built in to notify when the current ratio crosses into undervalued (–2σ) or overvalued (+2σ) zones, helping investors spot potential opportunities or risks.
In short, this tool bridges fundamentals with technical visualization, giving a quick snapshot of how today’s valuation compares to historical norms.
Script protegido
Este script se publica como código cerrado. No obstante, puede utilizarlo libremente y sin ninguna limitación. Obtenga más información aquí.
Exención de responsabilidad
La información y las publicaciones no constituyen, ni deben considerarse como asesoramiento o recomendaciones financieras, de inversión, de trading o de otro tipo proporcionadas o respaldadas por TradingView. Más información en Condiciones de uso.