OPEN-SOURCE SCRIPT
Actualizado Automatic Fibonacci Retracement Golden Pocket (GP)
Main info
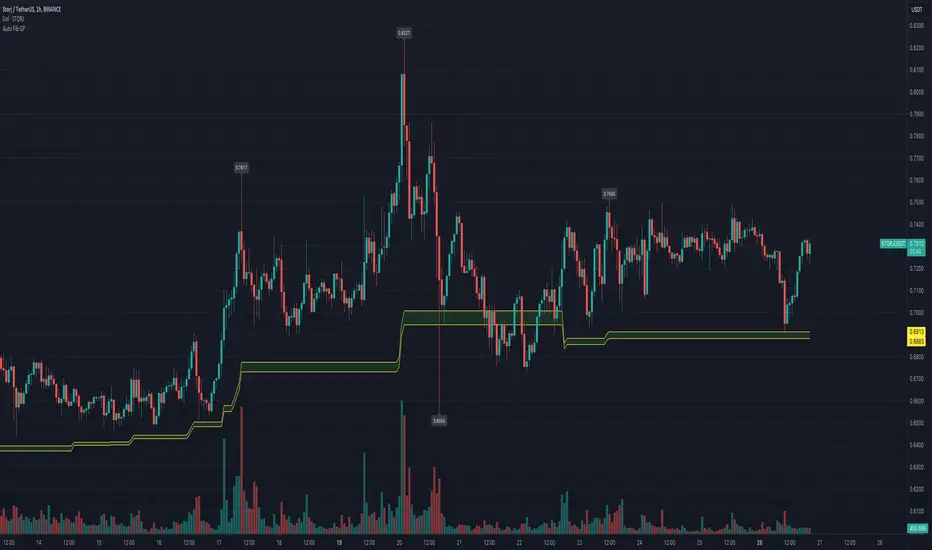
This script automatically draws you the Fibonacci retracement level called golden pocket from the latest detected pivot point to the actual price. This level is very popular among traders because the price tends to reverse on this level pretty often. You should use this on higher timeframes 15m+.
It is good to keep in mind that this level alone is not enough, you should still have another level there to enter the trade, for example golden pocket in combination with a demand zone is pretty solid. :)
Settings
If you want any updates, just feel free to write me :)
This script automatically draws you the Fibonacci retracement level called golden pocket from the latest detected pivot point to the actual price. This level is very popular among traders because the price tends to reverse on this level pretty often. You should use this on higher timeframes 15m+.
It is good to keep in mind that this level alone is not enough, you should still have another level there to enter the trade, for example golden pocket in combination with a demand zone is pretty solid. :)
Settings
- The length for pivot point calculation is available in the script settings.
- You can enable inverted golden pocket (for shorts)
- You can hide/show the pivot point labels
If you want any updates, just feel free to write me :)
Notas de prensa
Added fill between lines based on user's feedback. Users can configure it in settings -> style.Notas de prensa
Bugfix - Accidentally published wrong fill for inverted level.Notas de prensa
- change colors - add green fill for longs and red fill for shorts
- add 0.5 level based on user feedback
Script de código abierto
Fiel al espíritu de TradingView, el creador de este script lo ha convertido en código abierto, para que los traders puedan revisar y verificar su funcionalidad. ¡Enhorabuena al autor! Aunque puede utilizarlo de forma gratuita, recuerde que la republicación del código está sujeta a nuestras Normas internas.
Exención de responsabilidad
La información y las publicaciones no constituyen, ni deben considerarse como asesoramiento o recomendaciones financieras, de inversión, de trading o de otro tipo proporcionadas o respaldadas por TradingView. Más información en Condiciones de uso.