OPEN-SOURCE SCRIPT
Actualizado TrianglePoint strategy
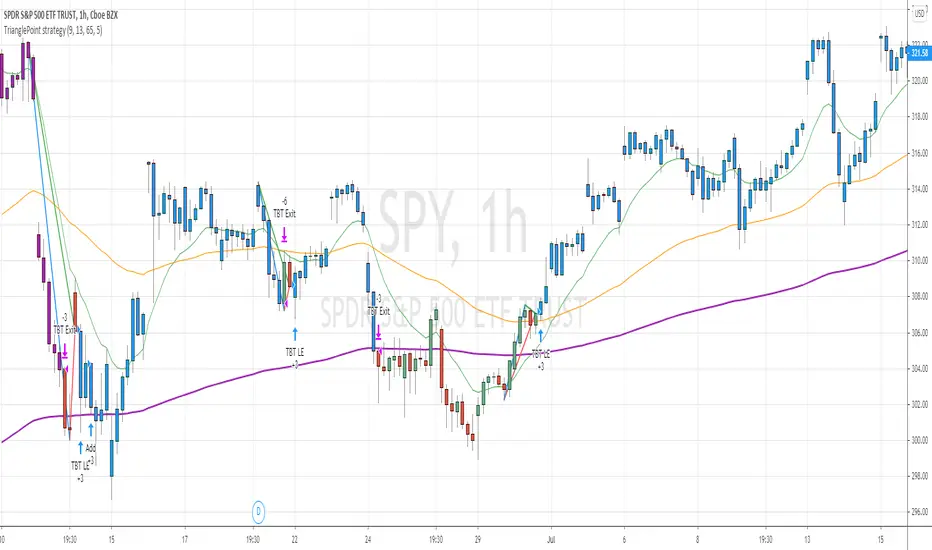
This is trend following strategy ... when price is trading well above 200 ema and forms a triangle (based on number of bars defined)
BUY
====
when fast ema > 200 ema
check for triangle of last N bars (default set to 9)
EXIT
======
when fast ema crosses down middle term ema
if price reaches above 5% of buy , it changes the color to purple. You can close any time or wait for above signal.
STOP LOSS
=======
stop loss default value set to 5%
Note: No triangle shown on the chart. I will find out how to add the lines to the chart.
Warning
=========
For the use of educational purposes only
Notas de prensa
I have added Triangle drawings to the chart.Also I have noticed that when position is taken LONG, mostly price reaches the half of the height of the Triangle. You can lock profits there or raise the stop loss ....
if the price goes south (downwards) half of the height of the triangle , you can wind up the position rather than waiting for defined 5% loss
Script de código abierto
Fiel al espíritu de TradingView, el creador de este script lo ha convertido en código abierto, para que los traders puedan revisar y verificar su funcionalidad. ¡Enhorabuena al autor! Aunque puede utilizarlo de forma gratuita, recuerde que la republicación del código está sujeta a nuestras Normas internas.
Exención de responsabilidad
La información y las publicaciones no constituyen, ni deben considerarse como asesoramiento o recomendaciones financieras, de inversión, de trading o de otro tipo proporcionadas o respaldadas por TradingView. Más información en Condiciones de uso.