OPEN-SOURCE SCRIPT
Actualizado Brown's Exponential Smoothing (BES)
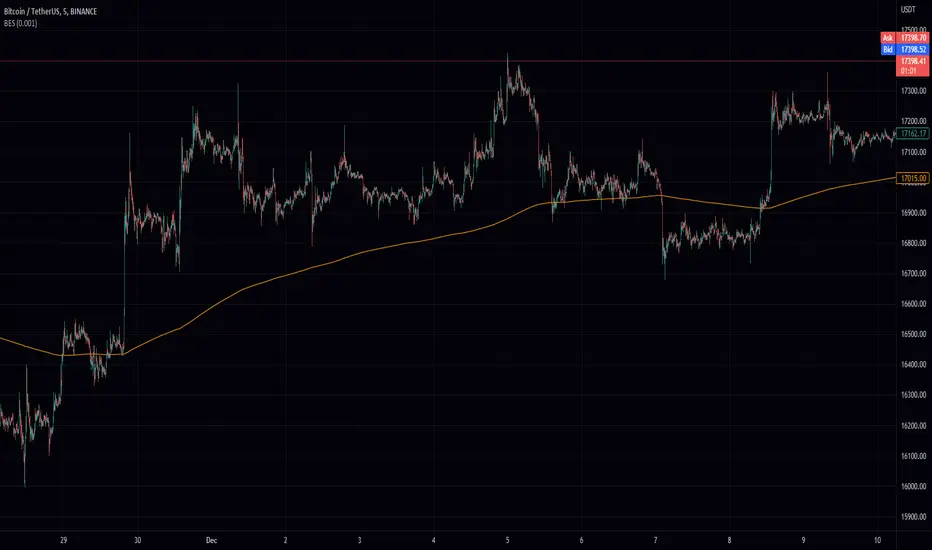
The Brown's Exponential Smoothing indicator is a smoothing function that uses an exponentially weighted moving average to filter the input data. The "alpha" parameter controls the degree of smoothing, with a smaller value resulting in more smoothing and a larger value resulting in less smoothing.
The indicator is implemented as a function, bes, which takes two arguments: source and alpha. The source argument specifies the input data to be smoothed, and the alpha argument specifies the degree of smoothing. The default value for alpha is 0.7, but it can be modified by the user using an input field.
The bes function calculates a smoothed value using the current value of the input data and the previously calculated smoothed value, and updates the value of the smoothed data. This process is repeated for each data point in the input data, resulting in a smoothed version of the data.
The resulting smoothed data is then plotted on the chart using the plot function.
The "BES" indicator can be useful for smoothing noisy or volatile data and making trends in the data more discernible. It may be particularly useful in situations where the input data is highly variable or difficult to interpret due to noise. By adjusting the value of the alpha parameter, the user can control the degree of smoothing applied to the data, allowing them to tailor the indicator to their specific needs and preferences.
Notas de prensa
bug fixNotas de prensa
minor fixScript de código abierto
Fiel al espíritu de TradingView, el creador de este script lo ha convertido en código abierto, para que los traders puedan revisar y verificar su funcionalidad. ¡Enhorabuena al autor! Aunque puede utilizarlo de forma gratuita, recuerde que la republicación del código está sujeta a nuestras Normas internas.
Exención de responsabilidad
La información y las publicaciones no constituyen, ni deben considerarse como asesoramiento o recomendaciones financieras, de inversión, de trading o de otro tipo proporcionadas o respaldadas por TradingView. Más información en Condiciones de uso.
Script de código abierto
Fiel al espíritu de TradingView, el creador de este script lo ha convertido en código abierto, para que los traders puedan revisar y verificar su funcionalidad. ¡Enhorabuena al autor! Aunque puede utilizarlo de forma gratuita, recuerde que la republicación del código está sujeta a nuestras Normas internas.
Exención de responsabilidad
La información y las publicaciones no constituyen, ni deben considerarse como asesoramiento o recomendaciones financieras, de inversión, de trading o de otro tipo proporcionadas o respaldadas por TradingView. Más información en Condiciones de uso.