OPEN-SOURCE SCRIPT
PheeTrades - Value Area Levels (VAH / VAL / POC Visualizer)

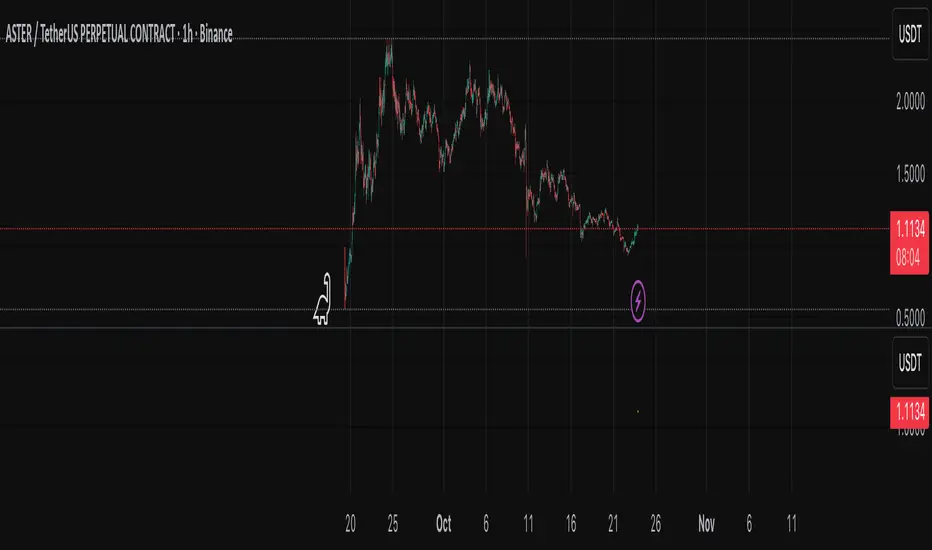
This script helps traders quickly visualize key Volume Profile–style levels such as Value Area High (VAH), Value Area Low (VAL), and Point of Control (POC) using recent price and volume data.
While TradingView’s built-in Volume Profile tool is great for manual analysis, this indicator automatically calculates and plots approximate value zones directly on your chart — ideal for traders who want to identify high-probability support and resistance areas without drawing a fixed range every time.
Features:
Calculates short-term VAH, VAL, and POC based on a user-defined lookback period.
Plots color-coded levels for quick visual reference.
Helps identify “fair value” zones where most trading activity occurred.
Useful for detecting breakout or mean-reversion opportunities around value extremes.
How to use:
Apply the script to any chart and set your preferred lookback period.
VAH (red line): potential upper resistance or overbought zone.
VAL (green line): potential lower support or accumulation zone.
POC (orange line): price level with the highest traded activity — often a magnet for price.
Note:
This is a simplified Value Area model meant for educational and analytical use. It does not replace TradingView’s official Volume Profile or broker-level volume distribution data.
Script de código abierto
Fiel al espíritu de TradingView, el creador de este script lo ha convertido en código abierto, para que los traders puedan revisar y verificar su funcionalidad. ¡Enhorabuena al autor! Aunque puede utilizarlo de forma gratuita, recuerde que la republicación del código está sujeta a nuestras Normas internas.
Exención de responsabilidad
La información y las publicaciones no constituyen, ni deben considerarse como asesoramiento o recomendaciones financieras, de inversión, de trading o de otro tipo proporcionadas o respaldadas por TradingView. Más información en Condiciones de uso.