OPEN-SOURCE SCRIPT
Trident Finder
Introduction to the Trident Finder
The Trident Finder is a Pine Script indicator that identifies unique bullish and bearish patterns called Tridents. These patterns are based on specific relationships between consecutive candles, combined with a simple moving average (SMA) filter for added precision. By spotting these patterns, traders can potentially identify high-probability reversal points or trend continuations.
Core Logic
The indicator identifies two patterns:
Bullish Trident
A bullish Trident forms when:
Candle[2] (two candles back) has its High-Low range entirely above Candle[1] (the preceding candle).
Candle[0] (the current candle) has its Open-High-Low-Close (OHLC) above the Low of Candle[1].
Candle[0] closes higher than it opens and higher than Candle[1]’s close.
Candle[0] closes below the SMA, indicating a potential upward breakout against the trend.
Bearish Trident
A bearish Trident forms when:
Candle[2] has its High-Low range entirely below Candle[1].
Candle[0] has its OHLC below the High of Candle[1].
Candle[0] closes lower than it opens and lower than Candle[1]’s close.
Candle[0] closes above the SMA, indicating a potential downward breakout against the trend.
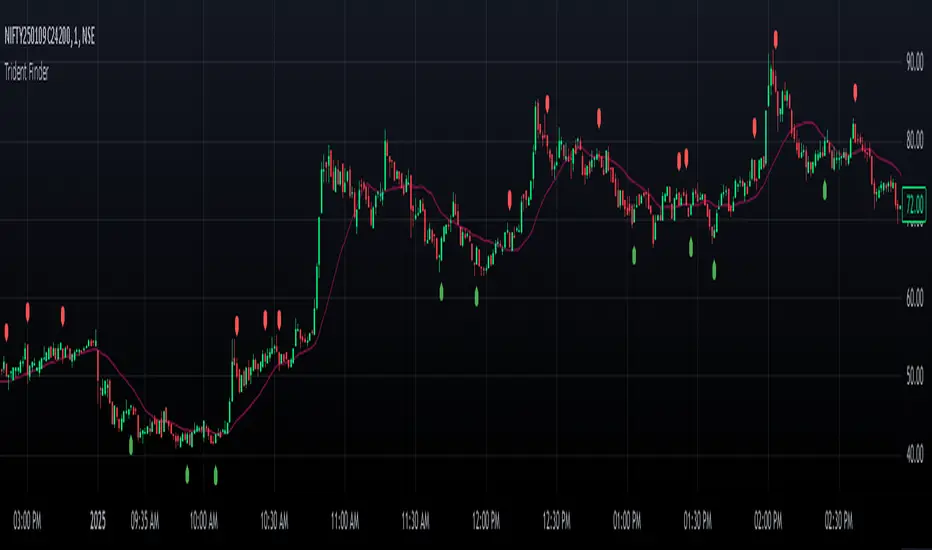
Visual Representation
Bullish Tridents are marked with green "Up" labels below the candle.
Bearish Tridents are marked with red "Down" labels above the candle.
The SMA is plotted as a maroon line to serve as a filter for the Trident patterns.
The Trident Finder is a Pine Script indicator that identifies unique bullish and bearish patterns called Tridents. These patterns are based on specific relationships between consecutive candles, combined with a simple moving average (SMA) filter for added precision. By spotting these patterns, traders can potentially identify high-probability reversal points or trend continuations.
Core Logic
The indicator identifies two patterns:
Bullish Trident
A bullish Trident forms when:
Candle[2] (two candles back) has its High-Low range entirely above Candle[1] (the preceding candle).
Candle[0] (the current candle) has its Open-High-Low-Close (OHLC) above the Low of Candle[1].
Candle[0] closes higher than it opens and higher than Candle[1]’s close.
Candle[0] closes below the SMA, indicating a potential upward breakout against the trend.
Bearish Trident
A bearish Trident forms when:
Candle[2] has its High-Low range entirely below Candle[1].
Candle[0] has its OHLC below the High of Candle[1].
Candle[0] closes lower than it opens and lower than Candle[1]’s close.
Candle[0] closes above the SMA, indicating a potential downward breakout against the trend.
Visual Representation
Bullish Tridents are marked with green "Up" labels below the candle.
Bearish Tridents are marked with red "Down" labels above the candle.
The SMA is plotted as a maroon line to serve as a filter for the Trident patterns.
Script de código abierto
Fiel al espíritu de TradingView, el creador de este script lo ha convertido en código abierto, para que los traders puedan revisar y verificar su funcionalidad. ¡Enhorabuena al autor! Aunque puede utilizarlo de forma gratuita, recuerde que la republicación del código está sujeta a nuestras Normas internas.
Exención de responsabilidad
La información y las publicaciones no constituyen, ni deben considerarse como asesoramiento o recomendaciones financieras, de inversión, de trading o de otro tipo proporcionadas o respaldadas por TradingView. Más información en Condiciones de uso.