INVITE-ONLY SCRIPT
D Indicators - Intraday Tool
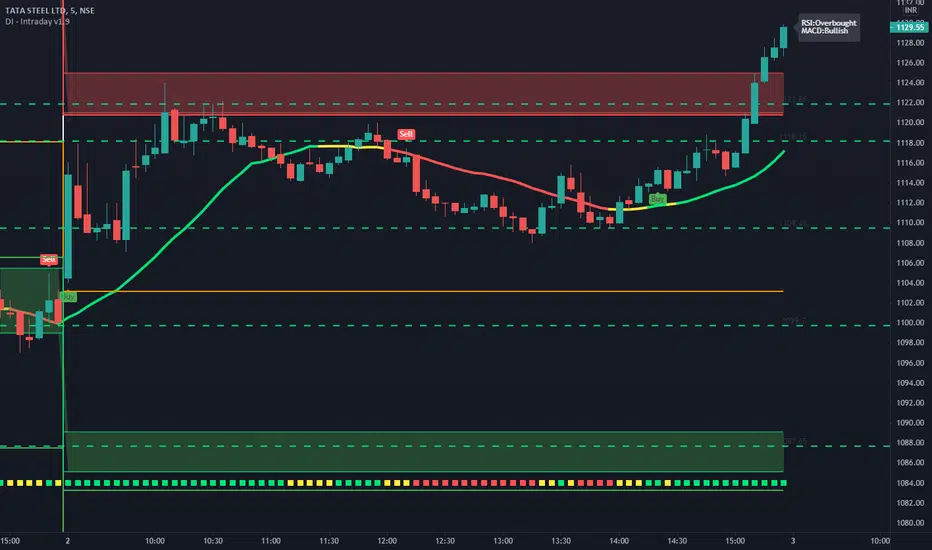
*Presenting a setup in which there is almost everything that an Intraday Trader needs.
1) Trend Indicators
# Both the trend indicators are multicolored.
# Very simple to Understand. Yellow means no trade zone, green - go long
, and red - go short.
# Trend Indicator 1 is an SMA(20). It will change its color according to the trend
of the market.
# Trend Indicator 2 will be plotted at the bottom of the screen. Based upon RSI
# Buy/Sell labels are synced with Trend Indicator 1. Wait for the close of the candle
to enter.
2) Pivot Points
# Plots Standard Pivots on the chart.
# Additional option for plotting Fibonacci pivots is also given.
# Plots standard pivots up to S5 and R5
# At the middle, it is pivot point (PP) level and multiple
support and resistance levels
3) Daily Range
# It plots 2 important levels at the starting of the day.
# 2 bands are plotted in the morning when the market opens,
resembling strong support/resistance zones.
4) Support/Resistance
# This indicator is used for finding support and resistance levels on charts.
# So one can plan Targets and SL accordingly
# Lines will change color automatically if any candle closes above the support/resistance line. It will change it's
to green. Similarly, it will change its color to red if the price is below the sup
5) CPR and CPR Next Day
# CPR is a very known indicator that indicates whether that helps in-stock selection.
# This is a very crucial indicator as it shows the CPR levels for the next day.
# One can make a guess by looking at the next day's CPR that whether the stock is going to be trendy/sideways the next day.
# Isn't it cool if you had some idea about tomorrow's behavior of the market's trend.
6) VWAP
7) Major Intraday Indicators
# Plots label indicating the status of RSI and MACD.
8) Bollinger Bands
# The Upper and Lower Bands are used as a way to measure volatility
by observing the relationship between the Bands and price
9) First bar of the day
# Plots the high and low of the first candle.
10) Different buy/sell labels and EHMA for forex.
Thanks are regards,
D Indicators
Script que requiere invitación
El acceso a este script está restringido a los usuarios autorizados por el autor y, por regla general, es de pago. Puede añadirlo a sus favoritos, pero solo podrá usarlo si solicita permiso al autor y éste le autoriza. Para obtener más información, póngase en contacto con D_Indicators o siga las siguientes instrucciones del autor.
TradingView recomienda no comprar ni utilizar un script si su autor no le ofrece total confianza o cuando no entienda cómo funciona. En muchos casos, puede encontrar una buena alternativa de código abierto de forma gratuita en nuestros Scripts de la comunidad.
Instrucciones del autor
″For access, please contact us.
📞: +91 - 7984128073
WhatsApp: https://wa.me/message/PWOK6HXQWJ6LF1
Telegram:
http://t.me/dindicators1
¿Quiere utilizar este script en un gráfico?
Advertencia: Por favor, leer antes de solicitar acceso.
Exención de responsabilidad
La información y las publicaciones que ofrecemos, no implican ni constituyen un asesoramiento financiero, ni de inversión, trading o cualquier otro tipo de consejo o recomendación emitida o respaldada por TradingView. Puede obtener información adicional en las Condiciones de uso.