PROTECTED SOURCE SCRIPT
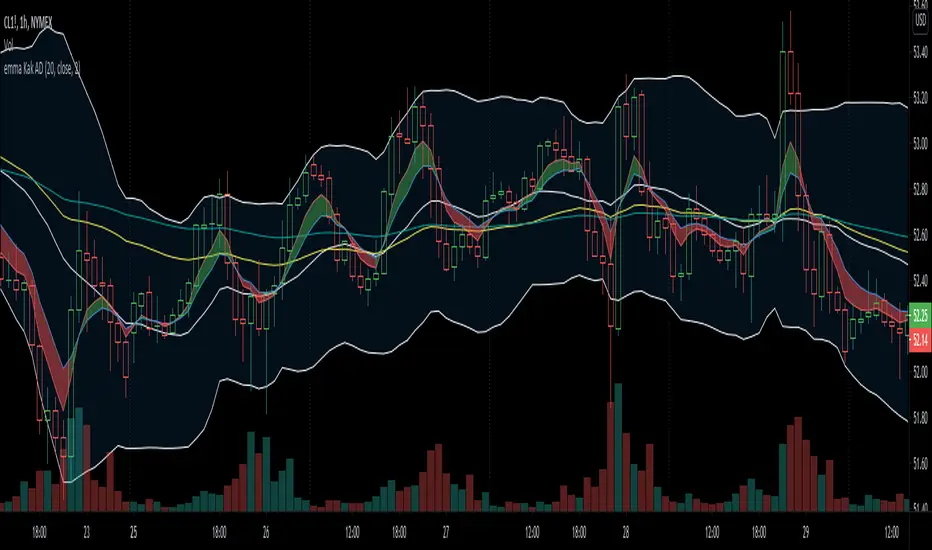
emma Kak AD

Basic guidelines
EMA 5 (red line) crossing EMA 9 (blue line) = Short term trend
Middle Bollinger Band crossing EMA 50 (yellow)= Medium term trend
EMA 50 crossing EMA 100 (green)= Long term trend
Cross up = Buy
Cross down = Sell
These EMA lines also act as the supports and resistances.
The way indicators read same as on others time frame. Higher time frame indicate stronger signal compared to lower time frame. However lower time frame will move earlier.
HOW TO READ INDICATOR
• Ema 5 cross up ema 9, - buy. filled with green
• ema 5 cross up ema 9, cs open above ma 20 – focus buy
• ema 5 & ema 9 cross up ma 20, cs open above ema 50 – focus buy
• ema 5, ema 9, ma20 cross up ema 50, cs open above ema100 – focus buy
• ema 5 cross bawah ema 9 - sell. filled with red
• ema 5 cross bawah ema 9, cs open below ma 20 – focus sell
• ema 5 & ema 9 cross bawah ma 20, cs open below ema 50 – focus sell
• ema 5, ema 9, ma20 cross bawah ema 50, cs open below ema 100 – focus sell
Script protegido
Este script se publica como código cerrado. Sin embargo, puede utilizarlo libremente y sin limitaciones: obtenga más información aquí.
Exención de responsabilidad
La información y las publicaciones que ofrecemos, no implican ni constituyen un asesoramiento financiero, ni de inversión, trading o cualquier otro tipo de consejo o recomendación emitida o respaldada por TradingView. Puede obtener información adicional en las Condiciones de uso.